1. Introduction
Despite the tremendous human efforts and the massive expenditures, the health care systems at both local and international levels are still suffering from a severe gap between the provided services and the real needs. This can be clearly shown with the appearance of the COVID-19 that affected more than 22 million people and caused the death of 777 thousand until August 20, 2020. Against such a pandemic, governments were unable to defend their citizens. Thus, their rescue plans consisted of administering lockdown and awareness campaigns about respecting social distancing, sanitizing, washing hands, and wearing protective masks. The healthcare ecosystem had no sufficient staff, hospitals, and beds to face this ongoing tragedy, where some countries lost control of this epidemic. Hence, researchers have focused on studying the behavior of COVID-19 in different points of view [1] [2] [3]. It has already been widely recognized that data science—tools and techniques—can potentially have a vital role in tracking the behavior of COVID-19 in terms of the geographic distribution of the outbreak and the evolution of its hot spots.
On the one hand, some authors such as [4] [5] [6] [7] propose data clustering and analysis techniques for COVID-19. For instance, the authors of [4] propose a data analysis method aiming to find a correlation between the temperature condition and the cases’ situations for different regions of China. The proposed method uses the K-means algorithm in order to show the trend effects of temperature on each region. The results showed that the temperature condition could not be the only significant factor for the outbreak of COVID-19. In [5], the authors introduce a clustering model based on the generalized K-means to group the state-level data sets for the spread of the epidemic in the United States. To select the optimal clusters number, the authors use two selectors, e.g., Akaike information criterion and Bayesian information criterion, and they prove that the nations are optimally grouped into six clusters regarding the outbreak of the pandemic. In [6], the authors propose a data analysis framework based on the Python language that allows cleaning up, classifying, and visualizing the COVID-19 data. Mainly, the proposed framework uses a data exploratory approach, in particular clustering and bivariate analysis. This approach verified that the rate of deaths is linearly proportional to the percentage of elderly persons in most countries. On the other hand, the authors of [8] [9] [10] [11] are dedicated to predicting the outbreak growth of COVID-19. For instance, the authors of [8] propose a hybrid artificial intelligence technique for predicting the COVID-19 spread called ISI, improved susceptible-infected. Mainly, ISI uses natural language processing combined with the long short-term memory to forecast the infection rates caused by the virus’s propagation. According to the proposed technique, the authors prove that the patients touched by COVID-19 had a higher contamination rate after eight days of infection. In [9], the authors use four traditional prediction models (linear regression, exponential smoothing, support vector machine, and LASSO) to forecast the spreading growth of COVID-19. By applying such techniques on the confirmed cases, death, and recovery rates, the authors show that the exponential smoothing gives the best forecasting accuracy while the support vector machine gives the worst one. The authors of [10] propose a model that benefits from the relationships between the nearest countries to estimate the progress of COVID-19. The model takes as input several metrics such as the number of cases, population per 1 M people, ARIMA parameters, and the polynomial function, then it finds, as output, a correlation between the coronavirus spread and the population in each country.
Unfortunately, despite the signficant number of proposed techniques, the virus’s outbreak continues to grow without any clear understating of the current situation and its future progress. In this paper, we tackle a new trend in studying the spread of COVID-19 by proposing an accurate framework called COMAP consisting of two stages: clustering and prediction. Unlike the most clustering techniques, the first stage does not require the initial number of clusters, but it dynamically finds the optimal one according to the virus’s spread across the countries. On the other hand, we adopted two well-known deep learning techniques, e.g., LSTM and Prophet, applied in several domains to the COVID-19 case to raise the precision of its outbreak.
The rest of this paper has the following structure. In Section 2, we describe the problem according to the WHO logging. Sections 3 and 4 detail the clustering and prediction stages proposed in our framework. Section 5 exposes the simulation results and discusses the performance of the COMAP framework. Lastly, the paper is concluded in Section 6.
2. COVID-19 Logging and Problem Formulation
One of WHO’s main missions consists of monitoring the global health system and collecting the data related to dangerous diseases and viruses. Mainly, with the emergence of COVID-19 in January 2020, WHO started to gather all information related to the outbreak of the pandemic and the number of infected persons, to closely supervise its progress and severity. Daily statistics were published by each country and reported to the WHO, which, in turn, categorizes the data with attributes describing the number of daily confirmed, death, and recovered cases. Therefore, we mathematically formulate the analysis problem of COVID-19 as follows: given the set of countries
, where
is the total number of countries recorded in the WHO table. Each country
has its own set of records for each attribute collected starting from the emergence of the virus until the date of this paper submission, e.g.
;
is the total number of records collected for an attribute and
is the number of cases detected during the kth day. Hence, the record sets of all countries according to a specific attribute is defined as:
. Therefore, our objective is to study and analyze the data sets in
using clustering and prediction approaches in order to understand the behavior of COVID-19 in the world countries.
3. COVID-19 Clustering Stage
In machine learning, clustering is a set of unsupervised algorithms used to classify unlabeled data into clusters. These algorithms are integrated into various kinds of applications [12] [13] [14]. One of the most well-known clustering algorithms used in many data science and machine learning classes is K-means [15]. However, K-means faces two main challenges: first, the selection of the cluster number (K) that is a crucial decision because it determines the accuracy of the obtained clusters; second, the convergence criterion function that can highly affect the number of iterations thus, increasing the computation process. Therefore, to conquer these difficulties, we propose a new version of K-means, called Corona-based K-means or Co-means, that adapts the analysis of variance (ANOVA) with the Bartlett test to the traditional K-means algorithm. Co-means has an objective to group the countries having similar COVID-19 spread into the same cluster. This allows the WHO to study the severity of COVID-19 inside each cluster and verify the government procedures’ seriousness, efficiency, and people’s adherence. In the next sections, we first recall the ANOVA model and Bartlett test, followed by the description of the new clustering algorithm called Co-means. Then, we introduce a new metric that allows us to assign the risk level of COVID-19 for the countries inside each cluster.
3.1. ANOVA and Bartlett Test
In statistics, the analysis of variance (ANOVA) is one of the most effective ways to determine whether the data sets belong to the same population and have the same variance, e.g., the null hypothesis, or not. Hence, it comes the statistical test’s role by specifying a threshold for the significance level of the variance between data sets. In our work, we focus on the Bartlett test [16] that does not assume any constraint about the normality of data which works based on the following two steps.
3.1.1. Variance Computation
The first step aims to calculate the variance, V, between the COVID-19 data sets for all countries according to the Bartlett equation [16]:
(1)
where:
•
indicates the countries’ number
•
indicates the records’ number collected for the country
•
is the record variance of the country
• N is the total number of records collected for all countries and it is calculated as follows:
•
is the pooled variance that can be calculated as:
3.1.2. Significance Decision
In order to check its significance, the Bartlett test compares the value of V to a defined threshold
calculated according to the Chi-square table. Subsequently,
indicates the critical value of the variance corresponding to the degree of freedom
with significance level
. Therefore, the decision is based on the following:
• if
then the null hypothesis is rejected and the variance between the sets is significant.
• if
then the variance between the sets is not significant and they have similar variances.
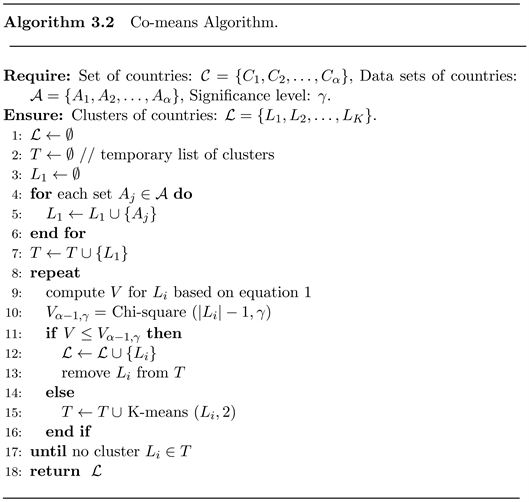
3.2. Corona-Based K-Means Algorithm: Co-Means
This section aims to integrate the ANOVA and Bartlett test to the traditional K-means in order to produce a more accurate clustering algorithm, e.g. Co-means. Indeed, Co-means is two-fold: first, it dynamically finds the optimal number of clusters without using the trial-and-error method adapted in most existing algorithms. Second, it uses a new convergence criterion to increase the accuracy of the obtained clusters. Basically, Co-means assumes that COVID-19 spreads similarly in all countries, thus, they are assigned to the same cluster, e.g., the initial cluster. Then, it recursively divides the initial cluster into small clusters every time a significant variance inside the new cluster is detected. The process of cluster division is stops when the null hypothesis is accepted in all the obtained clusters, which are used as a criterion function in our algorithm. Algorithm 0.0.2 describes the process of Co-means that takes, as input, the data sets of the daily confirmed cases for all countries, e.g.,
, and finds the clusters of countries having the same COVID-19 spread, e.g.,
. First, all countries are considered similar in terms of the outbreak, and they are assigned to the set of clusters T (lines 2-7). Then, for each cluster in T, we calculate the variance between the data sets based on the Bartlett formula, e.g., equation 1, as well as the Bartlett threshold according to the Chi-square table (lines 9-10). Consequently, if the calculated variance is less than the threshold, then Co-means considers that the countries have the same virus spread, so they are added to the final list of clusters
(lines 11-13). Otherwise, when the variance is greater than the threshold, the countries have different speeds of spread; so, we divide the current cluster into two subclusters by applying the K-means algorithm (line 15). This iterative process continues until no more clusters on T thus, obtaining the final clusters of countries with similar COVID-19 behavior.
3.3. Risk Degree Metric
After forming all clusters, we propose a clustering analysis method that allows studying the spread of COVID-19 of countries at the same cluster and evaluates its risk. Hence, we introduce a new metric called risk degree referred to as
that measures the impact of COVID-19 of each cluster
. Subsequently,
is calculated based on three parameters:
• The percentage of confirmed cases in each cluster,
: this parameter aims to evaluate the effectiveness of the procedures taken by the countries of a cluster, and it is calculated as follows:
• The percentage of death cases in each cluster,
. This parameter allows us to validate the efficiency of the healthcare systems of countries in
in responding to the massive number of patients infected by the virus. Thus, the more the countries can hospitalize the patients and reduce the number of deaths, the more their system’s efficiency is.
is calculated as follows:
• The rapid spread of COVID-19 outbreak of each cluster,
. This parameter indicates the progress of the COVID-19 outbreak in the cluster
. Thus, the more the epidemic spreads in a country, the more the severity of its impact will be.
is considered as the mean variance of all countries in a cluster and calculated as follows:
Based on the above equations, the risk degree
of a cluster
is calculated according to the following formula:
(2)
Therefore, we assess the risk level of the COVID-19 according to the value of the risk degree, which mostly takes a value between 0 and 1. Subsequently, the risk assessment is shown in Table 1 based on three defined thresholds, e.g.,
where
and
. Indeed, the thresholds are configured by the experts or the WHO, and their values can change from period to another depending on the progress of the epidemic. Then, each cluster
is assigned a risk level and description according to its risk degree
. For instance, the countries of a cluster are considered in a risk level 1 with a safe situation if its risk degree equal to 0 while countries inside a cluster with a risk degree more than
are considered in high critical situation with risk level of 5.
4. COVID-19 Prediction Stage
In the second stage of our framework, we aim to study and analyze the spread of COVID-19 from the prediction point of view. While the clustering offers an overview of the countries affected by the pandemic with its current spread, the prediction approach allows governments and WHO to estimate its future progress. Hence, estimating the number of infected persons in the near future can help the relevant authorities in two directions; on the one hand, they can estimate the number of patients to be hospitalized, thus the need for medical equipment such as PCR, ventilators, masks, and gloves, required to withstand the corona outbreak. The prediction also helps determine the needed medical staff and resources to serve the estimated number of patients, such as nurses, physicians, hospitals, and medical centers. On the other hand, the authorities can determine the hot zones most affected by the epidemic, thus, they decide about the precautions, procedures, and essential policies to reduce the virus’s spread. This may include the isolation of some geographical regions, closing of crowded places, restrictions on people’s movements, and preparation of quarantine places for infected people. This paper introduces two prediction methods that can efficiently estimate the epidemic outbreak on the scales of countries and continents: Long Short-Term Memory (LSTM) and Prophet.
![]()
Table 1. Evaluation of COVID-19 impact based on risk degree metric.
4.1. Recall of LSTM Method
Long Short-Term Memory (LSTM) [17] is an enhanced variant of repetitive neural network that deals with complicated cases related to processing, prediction and classification of time series. Typically, the architecture of the LSTM is based on the concept of cell state where data in the cell state can be added, removed, or reset using structures called gates. Subsequently, we distinguish between three gates (e.g. input, output and forget) for each cell state (Figure 1). As shown, every LSTM cell takes three variables as inputs: the input of the current time
, the previous cell state
and the hidden state
. Furthermore, a cell state consists of several neural layers where each one defines three variables: 1)
or the blocks’ number, that indicates the neuron’s capacity; 2)
, or the time steps’ number, that indicates the size of the input vector (
) used in the prediction of the next time step (
); 3) the features’ number (
) that indexes the time step.
4.2. Adapting LSTM to COVID-19
The rapid spread of the virus is highly dependent on the procedures set by each country. Hence, the consecutive numbers of daily infected persons are mostly correlated, making LSTM one of the ideal methods to forecast the future progress of coronavirus based on the previous collected data. Indeed, our objective is to predict the outbreak using LSTM at country-based and continent-based levels. At the local level, e.g. country-based, the goal of prediction is to help the governments avoid the worst scenario and take the precautions procedures before losing control. At the global level, e.g. continent-based, the prediction can help the WHO understand the effect of neighboring countries on the pandemic’s spread; this will help provide global standards and measures such as limiting travel between countries, and airports closing, to reduce the outbreak among countries.
In order to apply LSTM, we divide the data records of each country (respectively continent) into two parts: training and testing. Given the record set
of a country
then:
of the records are taken for the training of LSTM method while the remaining
records are used in testing the precision of the obtained results. Obviously, the more the percentage of the training part is, the more the LSTM accuracy will be. Therefore, we adopt the LSTM to forecast the outbreak of COVID-19 according to the following steps:
1) LSTM configuration: in this step, we adapt all the parameters of LSTM before training the data model. Indeed, the configuration includes two phases: data normalization and assigning the cell state parameters. On the one hand, data must be normalized to scale up their values into the same range [0, 1]. This is an essential task when studying the COVID-19 data due to the difference between the population numbers of countries, which highly affects the number of infected persons. For instance, the United States’ confirmed cases are much greater
than those in Spain but both countries may have an approximate spread level. In this work, we normalized the COVID-19 records of all countries using the MinMaxScaler algorithm before training and predicting the outbreak progress. Therefore, each record
is normalized according to Min-Max scaling based on the following equation:
(3)
where
and
represent the lowest and highest record values in
, respectively. On the other hand, this step also includes the assignment of the cell parameter values, e.g.,
,
and
. Indeed, in our simulation, we assign several values for each parameter in order to study its impact, except for
that is fixed to 1 since we only predict the confirmed cases feature.
2) LSTM training: in fact, studying and analyzing the previous data is an essential step to estimate its future behavior. Hence, it comes the importance of the training phase in LSTM aims to understand the records’ trends for each country and the correlations existing between the successive ones. Indeed, to train the data, we need to set up two concepts in LSTM: the error function and the optimization algorithm. Typically, the error function is used to estimate the model’s loss, while the optimization algorithm aims to reduce the current state’s error using a recursive process. In this work, the Mean Square Error (MSR) is set as the error function for our model and we used Adam optimizer as the optimization algorithm [18].
3) LSTM prediction: after training the data based on the first
records of each country, the last step aims to predict the future progress of the outbreak for the next days, weeks or months. Subsequently, the prediction process of LSTM takes into account the last
trained records to estimate the future ones.
4.3. Adapting Prophet to COVID-19
Prophet [19] is an open source forecasting tool built by Facebook’s Core Data Science team in 2008 and implemented in Python and R languages. Its core is composed of an additive model describing daily, weekly, and yearly seasonality, while consider holiday effects. Prophet can handle the missing values and outliers through the correlation discovered in the given historical data. Indeed, the Prophet method’s accuracy increases if a strong seasonal effect in the time series is detected, or the historical data’s increasing size. Upon its release, Prophet found its way into several domains but it mostly shines in the business where it is flexible to fit various business problem scenarios.
To apply the Prophet algorithm over COVID-19 datasets, we adopt the same scenario of the LSTM method, where each country and continent’s records are divided into training and testing parts. Then, in order to predict the future of the epidemic, the Prophet combines the main trends components in the following regression equation:
(4)
where:
•
: indicates the piecewise linear trend used by Prophet to select the change points in the data to detect changes in trends automatically.
•
: indicates the yearly seasonal trend that calculates, based on Fourier series, constant and predictable variations for one year.
•
: indicates the weekly seasonal trend that calculates, based on dummy variables, constant and predictable variations for one week.
•
: is the list of important holidays or events determined by the user. In our simulation, if a daily statistics of a country is not reported to the WHO, then it is considered as a missed or holiday data.
5. Results and Discussion
The performance of our technique, COMAP, is evaluated in terms of understanding the behavior of the COVID-19 outbreak. We implemented COMAP based on the Python language under the Anaconda framework, and we used the worldwide data collected by WHO, as described in Section 2. In our simulation, the performance of both clustering and prediction stages are tested based on the data of all countries. However, in the prediction stage, we only show the results of three countries (USA, Italy and Iran) scattered on various continents and they are highly affected by the COVID-19.
Table 2 summarizes the parameter description and configuration adapted in our simulations.
5.1. Performance Evaluation of Clustering Stage
This section studies the performance of the Co-means algorithm according to the following metrics.
5.1.1. Countries’ Distribution over Clusters
Indeed, one of the most advantages of the Co-means algorithm is its ability to dynamically find the optimal number of clusters based on the Bartlett threshold criterion. Figure 2 shows the number of obtained clusters along with their sizes, e.g., the number of countries inside each one, when varying the significance level values. The obtained results show that cluster formation is highly affected by the variation of γ allowing more understanding of the COVID-19 outbreak. We mainly observe that most of the obtained clusters have a size less than 10 while few exceed this value.
Furthermore, the following observations are eminent:
• The number of clusters K increases with the increasing of the value of γ. For instance, K increases from 34 to 46 when γ varied from 0.01 to 0.1. This is because the Bartlett test becomes more flexible regarding the variance between records when the significance level value increases.
• The average number of countries per cluster decreases with the increasing of γ. Subsequently, each cluster contains an average of 6.2, 5.1 and 4.5 countries when γ changed to 0.01, 0.05 and 0.1 respectively. This will decrease the variance between countries’ records in each cluster and enhance the understanding of the outbreak in such countries.
5.1.2. Cluster Analysis According to Risk Degree Metric
In Figure 3, we show the severity of the epidemic outbreak worldwide based on the risk degree metric calculated for each cluster, after applying Co-means. As we can see, COVID-19 has almost attacked all countries but with different impact levels. Apart from the Antarctica continent and according to
metric, we observe the following: 56.5% of countries are at the low level, 26.7% are at the medium level, 6.2% are seriously affected by the epidemic, and 10.5% are of high
![]()
Figure 2. Countries’ distribution over clusters in the function of the significance level.
![]()
Figure 3. COVID-19 severity based on the risk degree metric.
![]()
Figure 4. Comparison of clustering accuracy.
outbreak level. The results also confirm our mechanism’s behavior by assigning the same
value for countries having similar COVID-19 spread. For instance, we can see that the USA, Spain, Italy, Brazil, and Iran are assigned to the same cluster with the same risk level and the COVID-19 are quickly spread in such countries. Otherwise, we can notice that the number of confirmed cases is slowly increased in countries such as Finland, Mongolia, Niger, Mali, Thailand, and others. Furthermore, we can also notice that the countries in America (respectively in Africa) are more (respectively less) affected by COVID-19 than those in other continents.
5.1.3. Clustering Accuracy
An important metric to asses any clustering algorithm is by calculating the accuracy. A good clustering accuracy is obtained when the difference within clusters is minimized and maximized between clusters. This work focuses on the mean square error (MSE) as a well-known and most used metric to calculate the clustering accuracy. Figure 4 shows the average MSE of all clusters by applying traditional K-means, Co-means and the Enhanced K-means (EK-means) proposed in [4]. The obtained results show that Co-means outperforms K-means and EK-means in terms of reducing the clustering error in all cases. Subsequently, Co-means optimizes the clustering accuracy up to 77% and 49% comparing to K-means and EK-means, respectively. We can also observe that Co-means ensures a high level of similarity within the clusters, which strongly confirms the behavior of our mechanism by grouping countries having similar COVID-19 spread in the same cluster. Furthermore, we notice that the accuracy of Co-means increases with the increase of γ value because of the decreasing average countries per cluster (see Figure 2).
5.2. Performance Evaluation of Prediction Stage
This section studies the performance of both prediction techniques (LSTM and Prophet) according to the following metrics.
5.2.1. Prediction Accuracy at Country Level
The prediction approach plays a vital role in combating COVID-19 due to its ability to provide an approximate view about the future number of infected persons and determine the procedures needed to reduce the number of deaths. In Figure 5, we show LSTM and Prophet’s accuracy in our mechanism to predict the confirmed cases in three different countries while varying the training data percentage. The results show a common behavior of the COVID-19 in all countries; at the beginning of its emergence, the epidemic exponentially spreads reaching a critical point, then it decreases for a certain amount of time. This indicates that most countries, including the mentioned ones, did not seriously face the outbreak of this virus, and they did not implement efficient policies and procedures to limit its spread. In addition, the people’s commitment in such countries was insignificant, which led to quickly increasing the number of deaths and leading to healthcare system’s failure in some.
According to Figure 5, we also observe that LSTM gives more accurate results than those of Prophet for different countries and
values. This is due to two reasons; first, the future values of confirmed cases in LSTM are estimated based on the last
registered records, while the Prophet method takes into account the trend variation from the beginning of the set of records. Second, LSTM uses a back propagation approach in each record prediction during the training stage to tune the inputs’ weights while Prophet is highly based on seasonality and yearly conditions that are not yet existing in COVID-19 data. Furthermore, the results show the following observations:
• The accuracy of both methods increases with the increasing of the percentage of the training data. This is because each method will further analyze and understand the variation existing in the data records leading to increasing the accuracy of the predicted data.
• Each method’s accuracy can differ from one country to another depending on the obtained records’ variation. For instance, the accuracy of LSTM in the case of Italy is greater than those obtained in other countries, while the most accurate results of Prophet are noticed in the case of Iran.
![]() (a) [USA]
(a) [USA]![]() (b) [Italy]
(b) [Italy]![]() (c) [Iran]
(c) [Iran]
Figure 5. Prediction accuracy of LSTM and Prophet methods at the country level.
5.2.2. Prediction Accuracy at Continent Level
Sometimes, the outbreak of any disease will not only affect the people of a country but it may propagate to its neighbors. Hence, monitoring and predicting the spread of the COVID-19 at the global level is considered as one of the missions of WHO. In Figure 6, we show the accuracy of LSTM and Prophet methods in predicting the number of confirmed cases in each of the main continents, e.g., America, Europe, Asia and Africa. Similar to the results obtained at the country level, LSTM shows more prediction accuracy compared to the Prophet methods for various continents and values of the significance level. Obviously, we can
observe that America is largely suffering from the outbreak of COVID-19 while Africa indicates the minimum number of confirmed cases. Furthermore, the results show that the curves of America and Asia are increasing linearly, while those of other continents are linearly increasing followed by a linear decrease. This may result in strong procedures, including the shut down of most airports, and limiting the travel between countries, adopted recently by the European and African Unions.
Based on the results of Figure 6, the following observations are also eminent:
• The accuracy of each method increases with the increasing size of the training data (for the same reasons described in Figure 5).
• The accuracy of the Prophet method increases with the increasing size of the raw data. For instance, the predicted data of America and Asia is more accurate than those of Europe and Africa because the population numbers of the first ones are much more than those of the last ones. The main reason for that is the significant variation in the high size of data compared to that existing in small data sets. Thus, the accuracy of the Prophet will increase with the increase of the variation between data.
• The LSTM method will maintain a high accuracy level, independent of the data size. This is because LSTM is dependent on the previous data and not the whole ones.
5.3. More Evaluations
The objective of this section is to discuss our proposed mechanism more, while discussing the performance of both prediction and clustering stages under different conditions and circumstances.
From the data prediction point of view, LSTM and Prophet give accurate results for the outbreak of the epidemic at both country and continent levels. However, LSTM ensures more prediction accuracy independent of the variation existing among the data or its size. While, the accuracy of Prophet becomes more important when increasing the size of data or the size of the training data set.
From the data clustering point of view, Co-means ensures a high level of clustering accuracy, and it efficiently assigns countries having similar COVID-19 spread to the same cluster. Then, by evaluating the epidemic progress in each cluster using risk degree metric, we can conclude that the healthcare systems in most countries failed to combat the COVID-19 where the procedures and policies adopted were not sufficient to reduce its impact. Otherwise, few countries succeeded in fighting against the COVID-19 outbreak, and minimize the number of confirmed and death cases. Subsequently, we analyzed the procedures taken by such countries and we found that most of them adapted common strategies and policies that can be summarized as follows: 1) closing of the educational institutions in the early stage of the outbreak and switching to the online learning; 2) closing of the most entertaining places; 3) shut down of airport; 4) avoiding any type of people gathering; 4) maintaining social distancing; 5) constraints on people movements; 6) tracking of infected people through various kind of technologies; 7) obligation of following up the precautions such as mask, and hand sanitizers; 8) minimizing the number of employees in official and private sectors; 9) a hard penalty in case of policies violation.
6. Conclusions
Unfortunately, COVID-19 will not be the last epidemic that will attack our world; thus, new diseases and viruses will continue to appear and spread in the future. Hence, governments and authorities are requested to further invest in the public healthcare while researchers and the community should make more efforts in designing efficient algorithms to analyze the disease’s behavior. In this paper, we proposed an efficient framework called COMAP, aiming to track the outbreak of the epidemic and the effectiveness of the procedures and policies settled by worldwide countries. COMAP is composed of two stages: clustering and prediction. The first stage proposed the Co-means algorithm that allows to group countries having similar outbreak behavior in clusters, then a spread speed metric is proposed to evaluate the severity of the epidemic in each cluster. The second stage introduces two advanced deep learning methods, LSTM and Prophet, aiming to predict the future behavior of COVID-19 at country and continent levels. Through simulation on the data collected by WHO, we demonstrated the efficiency of COMAP in terms of returning accurate and realistic clustering and predictions.
Although its high efficiency, COMAP has several limitations that may be enhanced in future work. First, we seek to increase the performance of the Co-means algorithm proposed in the clustering stage. This may happen either by testing another statistical test rather than Bartlett or by finding new criteria that ensure more accurate clustering. Second, we seek to increase the prediction accuracy in the second stage of our mechanism. This may happen either by taking into consideration additional factors, such as geographical information of countries, when using LSTM method or by testing another predictive model.