Spatiotemporal Characteristics of Wetlands Ecosystem in the Niger Delta Region ()
1. Introduction
Wetland in Fagorite et al. (2019) usage refers to a distinct ecosystem that is inundated by water, either permanently or seasonally, where oxygen-free processes prevail. They identify wetlands as very significant and valuable components of the ecosystem. Wetlands are important for ecosystem services, nutrient cycles, soil formation and water treatment (Fagorite et al., 2019). Nigeria has an entire 11 Ramsar-listed wetland areas including coastal and freshwater wetlands, these together cover an area estimated to be 1,076,730 ha. Two of the Ramsar –listed sites are found in the Niger Delta region. The Niger Delta Region of Nigeria itself is a complex of wetlands covering about 76,000 sq km. It is very rich in biodiversity and it is considered the largest mangrove forest ecosystem in Africa (11,134 sq km) and the third largest in the world (Spalding et al., 1997; Wali et al., 2019) with a unique vast floodplain area (Ebeku, 2004). The wetland area of the Niger Delta has also been noted as one of Africa’s most valuable biodiversity hotspots, it provides living ground for numerous endemic species e.g the Niger Delta red Colobus Monkey and Sclater’s guenon (Ebeku 2004; Phil-Eze & Okoro 2009). The two Ramsar-listed wetlands of the Niger Delta are Upper Orashi Forest Reserve and Apoi Creek Forest. They are considered to fulfil Ramsar Listing Criteria Nos 1, 2 and 7. This is because they contain a representative, rare, or unique example of a natural or near-natural wetland type found within the appropriate biogeographic region. The Apoi Creek Forests located in Bayelsa state for example is estimated to be 29,213 ha and contains mainly mangrove forests, marshes and freshwater swamps (Ramsar Convention Secretariat, 2007; Ayansina, et al., 2015). It has high ecological value given its high flora and fauna composition such as the aforementioned Niger Delta red colobus monkey and the vulnerable African dwarf crocodile. It is also an important breeding and nursery ground for fish. It supports vulnerable, endangered, or critically endangered species or threatened ecological communities through the provision of habit or important ecosystem services (MEA, 2005). It supports a significant proportion of indigenous fish subspecies, species or families, life-history stages, species interactions and/or populations that are representative of wetland benefits and/or values and thereby contributes to global biological diversity (Ramsar Convention Secretariat, 2007, 2010a; Wali et al., 2019). Apoi Creek Forest (ACF) contains ecosystems that are common in the Niger Delta, such as marshes, mangroves and freshwater swamps, and thus represents an important reference site for the region. There are equally other wetlands that are not Ramsar-listed but are considered to be of significant local importance including the Olague Forest Reserve (OFR). It is estimated to encompass, 32,970 ha and primarily consists of mangroves and was established to ensure the sustainable use of the forest resources (FAO, 1999; IUCN & UNEP-WCMC, 2014; Ayansina et al., 2015; Wali et al., 2019).
This important resource is today facing a lot of stress due to rapid conversion to other uses to make way for urban expansion, particularly in Port Harcourt city where rapid population outburst occasioned by the changes in the socio-economic and political status of the city that have in turn resulted in conversion of wetland to accommodate new urban expansions (Innocent & Dapa, 2018). Sustainable future management of wetlands requires a reliable inventory of their characteristics (Nyandwi et al., 2016). It has been observed that these wetlands have been degraded over time. Numerous factors have been identified to be responsible for the degradation of natural wetlands ecosystems in Nigeria especially in the Niger Delta region (UNEP, 2011; Wali et al., 2019). The most important among them are, climate change scenarios, land demand by a large population, inadequate understanding of wetland values, misguided policies, inadequate environmental laws and regulations, and water diversion needed because of rapid economic growth (Ohimain et al., 2002). In 2011 UNEP’s reports show that wetlands around Ogoni land in the core Niger Delta communities are highly degraded and facing disintegration (UNEP, 2011; Wali et al., 2019).
Remotely Sensed data products often establish a vital element of Geographic Information Systems (GIS). Contemporary GIS gives users the capacity to conduct visual and quantitative analysis linking multiple types of digital spatial data, including remote imagery. In addition, GIS affords numerous tools that function with raster, remotely sensed and thematic imagery. For instance, a screen exhibition of remotely sensed imagery with co-registered spatial data can improve spatial data visualization and interpretation. GIS also allows quantitative comparisons between classified maps from remotely sensed data and other thematic data sets (Spruce et al., 2012). GIS, Remote Sensing and Global Positioning System (GPS) are basic tools for Geo-information techniques; play important role in various incorporated research connected to space and time, and are valuable methods used in obtaining, storing, managing, analyzing and visualizing ecological, wetlands/water resources, socio-economic data, land resource inventory and efficient policy decision making (Zhu et al., 2002). To acquire spatial and temporal information about wetlands, a satellite remote sensing imagery and Geographical Information System (GIS) applications are required as adapted by Guo et al. (2017).
James et al. (2007)assessed the extent and changes in the mangrove ecosystem of the Niger Delta. Others have tried to forecast the future pattern of land use and land cover change in the wetland ecosystem of the Port Harcourt metropolis of the region (Wali et al., 2018). In addition, Umeuduji et al. (2018) studied changes in land use and land cover from 1985-2016 with emphasis on wetland conservation and protection in the urban fringe area of Port Harcourt. Also, Eludoyin & Akinola (2015) studied spatio temporal analysis of wetlands modifications in Port-Harcourt metropolis, using geo-information techniques from 1984-2015. None of these studies have provided information that will guarantee the understanding of spatial temporal characteristics of wetlands ecosystem in the Niger Delta leaving a gap in knowledge. Thus, this study is an attempt to analyze spatial and temporal characteristics of wetlands ecosystem in the Niger Delta Region from 1986-2016, using GIS data, Remote Sensed Image interpretation data to provide valuable scientific information used in restoring, managing, protecting the wise use of wetlands both at regional and global scales.
2. Materials and Methods
The secondary data include raw satellite imageries obtained from the archive of the United States Geological Survey and Earth Explorer. The data set includes a notable period of four years landsat images for, 1986, 1996, 2006 and 2016. The maps were projected using Universal Transverse Mercator (UTM) projection system and datum WGS 84 of zone 32. Satellite images of the study area were acquired from the United State Geological Survey (USGS). The USGS uses the LandSat5 Thematic Mapper (TM), Landsat7 Enhanced Thematic Mapper (ETM+), Thermal Infrared Sensor (TIRS) and Landsat8 Operational Land Imager (OLI) to generate high resolution images that are useful for this type of study. Variants of the Thematic Mapper as indicated are improvements in LandSat technology over the years from the original design for enhanced image quality. The acquired images were used to derive land cover maps satellite imagery of the study area.
3. The Study Area
The area of study is Niger Delta Region of Nigeria, itself is an intricate of wetlands covering about 76,000 sq km a brief description of the geography is given below (Okonkwo et al., 2015; Izah, 2018). For the purpose of this study, the Niger Delta region is defined as comprising the area covered by the natural delta of the Niger River and the areas to the east and west of it. The natural limit of the Niger River Delta has been defined by its geology and hydrology (ERML, 1997; UNDP, 2016). Its northern boundaries are located close to the bifurcation of the Niger River at Aboh, while the western boundaries are around the Benin River respectively. The entire region covers 2370 square kilometers includes rivers, creeks and estuaries and 8600 square kilometers is made up of stagnant swamp (Akachi, 2011; Okonkwo et al., 2015; Izah, 2018). Possibly due to the nature of the area, the major distinct ecosystem found in the zone include barrier islands, estuaries, mangroves, freshwater swamps, lowland rainforests, creeks and creek-lets (Ajao & Anurigwo, 2002; Izah et al., 2017). Specifically, studies have mentioned the presence of six different ecological zones including rainforest, mangrove, flood forest zone, eastern flank, marsh forest zone and barrier islands (Blench, 2007; Ayanlade, 2014; Izah, 2018). Another study has classified the ecosystem to include rainforest, mangrove, freshwater swamps, mountain region and derived savanna (Ayanlade, 2014). This suggests slight variation in author’s opinion about different ecological zone in the Niger Delta. Typically, with the major ecological zones previously mentioned, many of them fall within the mangroves (estuarine, marine, barrier Island), freshwater forest and low land rainforest ecosystem. According to Akachi (2011) noted in Izah, (2018), the Niger Delta ecosystem is highly diverse and can support several terrestrial and aquatic life forms. In a broader sense Niger Delta region, consists of six states (see Figure 1) (Akwa Ibom, Bayelsa, Cross River, Delta, Edo, and Rivers) and 185 local governments (UNDP, 2016).
4. Location/Extent
From Geographical positioning, Niger Delta region of Nigeria is located along
![]() (Source: Cartography and GIS Unit, Dept. of Geography, UNN, 2021).
(Source: Cartography and GIS Unit, Dept. of Geography, UNN, 2021).
Figure 1. Niger Delta Region showing study states and sampling LGAs.
the Gulf of Guinea (Enaruvbe & Atafo, 2014). It is the world’s third largest and Africa’s largest Delta. It is also West and Central Africa’s most extensive wetland (Akegbejo-Samsons & Omoniyi, 2009). The region extends from Aboh (5˚33'49"N and 6˚31'38"E) in the North to palm point (4˚16'22"N and 6˚05'27"E) in the South. The East-West limit is between Benin River estuary (5˚44'11"N and 5˚3'49"E) in the West and Imo River estuary (4˚27'16"N and 7˚35'27"E) to the East (Niger Delta Environmental Survey (NDES, 1997)). The Niger Delta region extends over an area of about 75,000 square kilometers representing about 12 percent of Nigeria’s total surface area. The region situates along a coastline of 560 km, contains about two-thirds of the entire coastline of Nigeria and six of Nigeria’s constituent states.
5. Weather and Climate of the Study Area
The Niger Delta region of Nigeria features within a tropical monsoon climate of transitional zone of Koppen Af climatic types that varies from the hot equatorial forest type in the southern lowlands to the humid tropics in the northern highlands and the cool montane type in the Obudu plateau area with prolonged and heavy rainy season and very short dry season months in the region. Only the months of December and January truly qualifies as dry season months in the region. During the dry season, the northeast trade wind blowing over the Sahara Desert extends its dehydrating influence progressively towards the equator, reaching the southern coast of Nigeria in late December or early January. The period is known as the “Harmattan”, which is more noticeable in some years than others. The harmattan, which climatically influences many cities in West Africa, is less pronounced in the Niger Delta. The heaviest precipitation in the region occurs between March and October (Oyegun & Adeyemo, 1999). The mean annual rainfall is put at 2000 mm (Ayoade, 1993). But also ranges from over 4000 mm in the coastal towns of Bonny and Brass in Rivers and Bayelsa States respectively, and decreases inland to 3000 mm in the mid-delta around Ahoada in Rivers State, Yenagoa in Bayelsa State, and Warri in Delta States, respectively; and slightly less than 2400 mm in the northern parts of the region. In the north western portions including Edo and Ondo States, annual rainfall ranges from 1500 - 2000 mm. The Niger Delta region usually has a temporary cessation of rain commonly known as “August Break” (a dry spell) that comes in between the middle of the rainy season. The area has an average monthly temperature above 27˚C and there is adequate moisture in virtually all the months. In the region, temperatures are relatively constant (high with a mean maximum of about 34˚C and a mean minimum of about 21%); showing little variation throughout the course of the year. Relative humidity over Niger Delta is over 80% - 90% during the rainy season as a result of the prevalence of warm moist air mass and high evaporation from the numerous creeks and rivers during this season. In January, depicting the dry season, relative humidity is reduced considerably to about 50% - 60% as a result of the impact of the drier tropical continental air mass (Inyang, 1975).
6. Geology of the Study Area
The natural delta of the Niger River is a vast sedimentary basin. The deltaic deposits comprise mainly medium to coarse unconsolidated sands, silt, clay, shale and peat. The delta is mostly a flat, low-lying swampy basin crisscrossed by a dense network of meandering rivers and creeks. The development of Niger Delta resulted from the formation of the Benue trough as a failed arm of the rift triple and South American continents and subsequent opening of the South Atlantic trade route (Murat 1970; Evamy et al., 1978; Whiteman 1982). The Benue-Abakailiki trough was filled with sediments during the early Cretaceous time, later it’s under vent folding, faulting, and uplift with subsidence of the adjacent Anambra basin to the West and Afikpo Syncline to the East during the Santonian. The proto-Niger Delta ended in the Paleocene time. The coastal sedimentary basin of Nigeria was the scene of three depositional cycles. The first began with a marine incursion in the middle Cretaceous and was terminated by a mild folding phase in Santonian time. The second included the growth of a proto-Niger delta during the late Cretaceous and ended in a major Paleocene marine transgression. The third cycle, from Eocene to recent, marked the continuous growth of the main Niger delta. The Niger delta subsurface has a few three fold lithostratigrahic subdivision, comprising an upper sandy Benin formation, an intervening unit of alternating sandstone and shale named the Agbada formation, and a lower Shaly Akasa formation. These units are Akasa Formation, Agbada Formation, and the Benin Formation in order of decreasing age (Short & Stauble, 1965). The overall thickness of these Tertiary sediments is about 10,000 meters.
7. Relief/Drainage of the Study Area
There are four broad ecological zones in the region defined by both relief and hydrological characteristics (see Figure 2 and Figure 3). These are, from the coast inland, the coastal sandy barrier ridge zone, the mangrove swamp zone, the freshwater swamp zone and the lowland rainforest zone. The coastal sandy barrier zone, as the name suggests, is made up of a chain of sandy barrier islands, which are separated by numerous estuaries and inlets. The islands are generally less than one meter above the sea level at high tide. They extend along the outer coastline from the Benin River to the Imo River. Typically, they are 16 to 20 kilometres wide. Because of their relatively higher topography, which keeps them from the tidal influence of the marine and brackish waters, the coastal barrier islands support freshwater forests and associated fauna. These islands are also often flooded during the year when rainfall is heavy.
Moving inland, the mangrove swamp zone occurs immediately after the barrier islands. It is the swampiest of the ecological zones, being essentially a massive swamp dotted with islands of dry land covering about 10,240 square kilometres
![]() (Source: Cartography and GIS, Dept. of Geography, UNN, 2021).
(Source: Cartography and GIS, Dept. of Geography, UNN, 2021).
Figure 2. Relief of Niger Delta Region.
(Mosunmolu, 1998). Most of the zone is at elevations of less than one meter, and it is generally muddy and under tidal influence. Within the zone are feeder channels that move tidal waters into the swamp, connecting channels and inter-fluxes. The freshwater swamp zone is characterized by seasonal flooding. It is during the rainy season that its swampy characteristics are vividly obvious. It has the most distinct subdivisions, is most diverse in terms of biology and supports a similar ecology to the one in the coastal barrier islands. The zone’s three subdivisions are the flood forest zone or 'upper delta', the marsh forest zone and the eastern flank. The flood forest subdivision has large sand river channels, permanent creeks and seasonal flood creeks, and is inundated annually by the Niger River flood. Flood-free levees are common, while back swamps and cane forests help give the zone a highly diverse habitat. The marsh forest subdivision is also referred to as the transition zone. It is permanently swampy and under flooding from freshwater. Muddy swamp channels and raffia swamps can be found in the zone, and its species of wildlife are usually different from those of the flood forest zone. When assessing the eastern flank estuary, it is assumed to have been a flood forest zone when the Orashi River was a major tributary of the Niger Delta (Powell, 1995).
![]() (Source: Cartography and GIS, Dept. of Geography, UNN, 2021).
(Source: Cartography and GIS, Dept. of Geography, UNN, 2021).
Figure 3. Drainage of Niger Delta Region.
The lowland rainforest zone is in the northern part of the Niger Delta region, beyond the areas of dense river and creek networks. It is not considered within the area defined by the natural limits of the Niger Delta, but falls within the broader Niger Delta area. This is the least swampy part of the region. It has a varied geology and terrain, but sedimentary rock formations, mostly sandstone with some shale and limestone, underlie most areas. The rock formations present a ridge and valley topography. In some areas of Akwa Ibom, Cross River and Ondo states, the terrain is characterized by advanced gully erosion. In Edo, Cross River and Ondo states, there are areas of old, crystalline basement complex rocks, mainly granites, gneisses and granodiorite. These areas are characterized by rugged, rocky terrain with massive rock domes and inselbergs. Apart from the Niger River, the other distributaries rivers in the region include the Cross, Imo, Qua Iboe, Sobriero, Bonny, New Calabar, Otamiri and Orashi in the South-South, East; and Benin, Oluwa and Siluko in the West.
Figure 4 below shows the digital elevation model of the study area, delineating areas with higher elevation from areas with lower elevation. It is clearly depicted that areas around Akwa Ibom state have higher altitudes than other areas, also, the north eastern part of Rivers state too is higher than other areas. Areas
![]()
Figure 4. Digital elevation model of study area.
around Bayelsa and Rivers have very low altitudes and hence, the highest distribution of wetlands.
8. Soil and Vegetation of the Study Area
The Niger Delta region consists of Deltaic plain soils which are found in wetland and upland areas. The remnant wetland deltaic plain soil has sand (75%) with low clay content which increases down the subsoil. Surface soil colors are brown or very dark grayish brown. Surface soils are well drained having no mottles. The soils are strongly acid (pH 4.5). But acidity decreases down the profile. Organic matter content is low (2.5%). The carbon to nitrogen ratio is fairly high (Ayolagha & Onuegbu, 2001). Ofomata (1975) describes the soil of Niger Delta as being ferrallic soil which is rich in iron, but has low mineral reserve and therefore low fertility. He further attributes this to latitudinal location of the area that leads to heavy rainfall, which leaches the soil.
The vegetation of the Niger Delta region according to Udo (1981) is made up of equatorial rainforest. The vegetation could be subdivided into two major groups; the tropical rainforest and swamp forest (which is further sub-divided into fresh and mangrove swamps). However, the tropical forest and swamp forest characteristics have been lost to continuous agriculture and urbanization in such a way that the few patches that remain are found in shrines. The dominant plant species found in this area include; Elaeisguineensis (oil palm tree),Rhizophora racemoasa sp (Red mangrove),Dacroydes edulis (African pear), Psidiumguajava (Guava),Mangifera indica (Mango),Lophira alata,Gmelina arborea (Gmelina tree),Avicennia africana,R. mangle,R. harrisonia,Avicenia gerninas,Laguncularia recemosa,Nypa fruticans,Acrosticulum aureum and Paspalim vaginatum (NDES, 1997; Phil-Eze, 2001). Wildlife species of the Niger Delta region are Sclater’s guenon (Cercopithecus sclateri), Nigerian white-throated guenon (Cercopithecus erythrogaster pococki), red-capped mangabey (Cercocebustorquatus) and the endangered Nigeria-Cameroon chimpanzee (Pan troglodytes ellioti), Niger Delta Red Colobus monkey (Procolobusepieni), Nigerian white-throated guenon (Cercopithecus erythrogaster pococki) Heslop’s pygmy hippopotamus (Hexaprotodonliberiensisheslopi), Antelope, Grass cuter,deer, gorillas, and crocodile etc (Izah, 2018).
9. Methods of Data Analysis
Multiple Linear Regression were used to analyze the data. Multiple Linear Regression Analysis (MLRA) is a general statistical technique by which the relationship between the dependent variable (deaths) and set of independent variables (forms of bacterial indicators) can be analyzed. It is also an inferential tool which enables one to evaluate the relationship in a given population through the analysis of the sample. In other words, the independent variables which influence change are used for prediction (Gupta, 2011). The different percentages of various land cover in the study area over the years 1986, 1996, 2006, 2016 and 2020 were placed in table formats and analyzed to determine the relationship between water body changes and climate variable which include rainfall, maximum temperature and minimum temperature. The percentage changes in water body values were used as the Y (independent variable) and average data for rainfall, maximum temperature and minimum temperature were used as the X variable (dependent variables). The general expression of Multiple Linear Regression is a follows (Anyadike, 2009)
.
where, y is the dependent variable;
a is the base constant;
x1, x2, x3…xn for independent variables;
b1, b2, b3…bn for regression coefficients;
e is the error term.
The regression analysis was performed with the aid of the Statistical Package for Social Sciences (SPSS) Version 21.
The study also made used of Normalized Differential Vegetation Index (NDVI) as a proxy for this study because it is widely used and generally accepted. Further, it is one of the most cost-effective ways of determining vegetation cover especially in developing and least developed nations. NDVI is a good indicator of the ability of vegetation to absorb photosynthetically active radiation and has being widely used by scientists and researchers to estimate green biomass, leaf area index and patterns of productivity because the internal mesophyll structure of healthy green leaves strongly reflects NIR radiation, and leaf chlorophyll and other pigments absorb a large proportion of VIS radiation (Sellers & Schimel, 1993; Gausman et al., 1995; Olusegun & Adeyewa, 2013; Hussaini et al., 2021). A multi-temporal satellite data were acquired from Landsat5, Landsat7 and Landsat8 with 30 m spatial resolution of different epoch years of 1986, 1996, 2006 and 2016 were used in the study.
The satellite imageries were analyzed using GIS methods as thus:
· Computing of NDVI values for the entire study area by conversion of spectral reflectance values into NDVI values.
· The NDVI was calculated from reflectance measurements of the spectrum.
· Conversion of these NDVI values to scaled channel values by using density scaling method that measures apparent reflectance to sensor values.
· Display of image with NDVI and creation of a legend keeping the thresh –odd values. The greenness range is divided into discrete classes by slicing the range of NDVI classification and the method used is Natural Breaks (Jenks). Similar step was followed for all the four (4) different years’ image classification. A cursory look at pseudo color image of NDVI and classified output of NDVI image reveals that along the wetlands, water bodies and built-up areas yield negative values, their reflectance being more visible rather than near infrared (NIR) wavelengths.
· Spatiotemporal change detection of vegetation covers after NDVI images classification, it is necessary to know the overall percentage of change of general land surface based on NDVI derived image value.
10. Results and Discussion
The Spatiotemporal Characteristics of Wetland Changes
The total land area under study is 25,053.93 (km2). From early 1986 to 2016, the wetland structure in the Niger Delta region has undergone great changes Table 1 and Figures 5(a)-(d) show the size and proportions of land cover classes from 1986-2016. The analysis shows that in 1986, fallow land had a spatial extent of 4589.128 km2 (18.317%), built up area covered 1365.189 km2 (5.449%), vegetation covered 8243.995 km2 (32.905%), water bodies covered 1564.367 km2 (6.244%) and wetland covered 9291.249 km2 (37.085%). In 1996, fallow land covered 3409.84 km2 (13.61%) of the total land use while built up area, vegetation, water bodies and wetland covered 3667.645 km2 (14.639%), 8118.475 km2 (32.404%), 1608.713 km2 (6.421%) and 8499.796 km2 (33.926%) respectively. In 2006, fallow land covered 3064.346 km2 (12.231%), built up area covered 3957.268 km2 (15.795%), vegetation covered 7556.515 km2 (30.161%), water bodies covered 2017.092 km2 (8.051%) while wetland covered 8458.707 km2 (33.762%). In the year, 2016, fallow land occupied 6495.983 km2 (25.928%), built up area covered 4207.056 km2 (16.792%), vegetation covered 7054.184 km2
![]()
Table 1. Size and proportion of land cover classes from 1986-2016 (area covered in area km).
![]()
Figure 5. Supervised land-use land-cover classification of Landsat image.
(28.156%), water bodies covered 2019.096 km2 (8.059%) while wetland covered 5277.61 km2 (21.065%). The analysis thus shows that there is a shape reduction in the size of wetland between 2006-2016. In the same vein fallow, vegetation, and water bodies reduced in terms of spatial extent while built up area increased over time. Figures 5(a)-(d) show the supervised land-use/land cover classification of landsat image (1986, 1996, 2006 and 2016). From early 1986 to 2016, the wetland changes experienced a shift from Akwa Ibom to the central parts of the Niger Delta Region. Wetlands in the Akwa Ibom, Rivers State and Bayelsa area varied significantly during these years. From 2006 to 2016, the changes (including expansion and shrinkage) of all kinds of wetlands were concentrated more in the urban centers (see Plate 1(a) and Plate 1(b)).
The trend and rate of major land cover changes were analyzed using time series Landsat5 TM, Landsat7 ETM+ and Landsat8 OLI digital images from 1986, 1996, 2006 and 2016 (Figures 5(a)-(d)). To quantify the trend, rate, and percentage of change between the images, we used a time interval of 10 years from the benchmark of 1986. As shown in the tabular detail, the dominant land use types in the area were wetlands, which covered nearly 37.6%, 33.9%, 33.7% and 21.7% of the entire area for the years 1986, 1996, 2006, and 2016, respectively (Table 2) Follow by vegetation which covered as thus, 32.9% in 1986, 32.4% in 1996, 30.7% in 2006 and 28.6% in 2016 respectively. Land cover change with fallow land, water bodies, and built up classes were common in most parts of the area, and the conversion of wetlands land into arable agricultural land and closure area development were major changes in the past 30 years. The significant factors for land cover changes during these periods were attributed to population growth and its demand for additional cultivable land, land degradation on poor land management, rising demand for cash crops, partial implementation of policy strategies, and loose land.
The post-classification matrix (Table 2) shows the individual class percentage and change statistics for 4 cloud-free multi-temporal Landsat images. The percent land cover distribution, percent change in the areal extent of each land cover
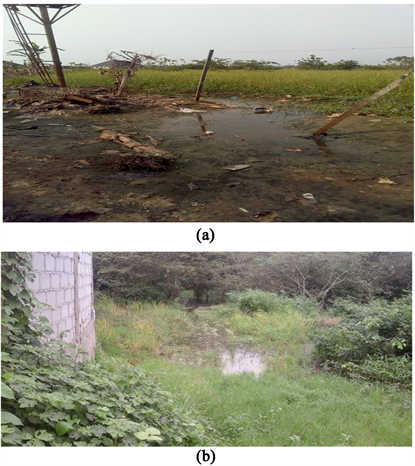
Plate 1. (a) A shrinking wetland at Uyo due to climate change scenarios. (b) An encroached wetland land in Yenagoa due to urbanization.
![]()
Table 2. Percentage of land cover changes from 1986-2016.
unit between initial and final state images, and rate of change expressed, and the time rate of change of final and initial state images are clearly presented in the table. In addition, the total land use unit areas, percentage coverage, and corresponding area ratio are indicated in Table 2. The tabular figure is self-explanatory to analyze the change statistics for the 5 major land cover type considered.
From Table 2, it can be observed that the vegetation land use class is continuously increasing with a significantly higher positive rate at the expense of the other land use class (Figures 5(a)-(d)). The largest increase of vegetation class in 2016 covered above 7054.184 area in Km (28.7%) of the total study area. However, there was a slight decrease in wetland within 2016. This was mainly due to the significant increase in some major land cover units, such as fallow land. Built-up areas showed a steady increase excepting the year 2006 and 2016, where the spatial extent has increased by 4207.056 area in Km from the current year.
Simulation/Computational Model
Regression Analysis:
Regression.
aPredictors: (Constant) Vegetation.
aDependent variable: Year; bPredictors: (Constant) Vegetation.
The Multiple Linear Regression Analysis (MLRA) clearly showed a linear relationship between decreases in vegetation resulting from time as shown in Table 3 and Table 5 above. The independent variables Times which was calculated as years. The other landuse variables are Fallow Land, Built Up, Water Body and Wetland as shown in the excluded variable.
The regression equation for Landuse Changes is given as
y = 2178.485 − 0.961 (Vegetation).
The coefficients therefore show frightening revelations. This means that the vegetation over the wetland area is constantly decreasing as the year advances.
The Anova in Table 4 showed huge significant relationship between time and vegetation decrease across the study area at 027 which is less than 0.05 significance level. This means that our hypothesis is accepted, there is a significant relationship between time and vegetation changes over the study area.
The excluded variable are fallow land, built up, water body and wetland, from Table 6 of significance, there is no significant relationship between time and the above variables as their significance values are above 0.05. Therefore the Ho is rejected for the following variables.
In other to test for further relationship, we applied the Pearson Correlations test analysis and the result is shown below.
From the result in Table 7 above, there is a strong relationship between the various landuse changes and time over the study area. Fallow land shows a weak relationship of 0.448, Built Up shows strong relationship of 0.87, Vegetation shows a strong negative relationship of −0.973, Water Body shows a strong relationship of 0.916 while wetland shows a strong negative relationship of −0.877.
aDependent variable: Year.
aDependent variable: Year; bPredictors in the model: (Constant) Vegetation.
*Correlation is significant at the 0.05 level (2-tailed).
From these coefficients, there is no much increase in the fallow land over the years. For built up areas, the coefficient shows that the area of study is increasing over the years and this could be attributed to population growth and development which affected the vegetation growth as the vegetation of the area is highly decreasing as rate of migration and birth increases. The water body and wetland shows positive relations and increase within the years and this can be attributed to current flood activities within the study area.
11. Conclusion and Recommendations
This study provides some systematic views on management and protection of wetlands in the Niger Delta region, especially for restoration and conservation of degraded wetlands. The study also shows changes in other land use classes in their peak periods. These changes in wetland landscape patterns will produce profound impacts in urban areas where there are rapid anthropogenic activities. Wetlands warming and drying will cause the shrinking and reduction of wetland in sizes from accelerated wetland pollution. Therefore, there is an interaction and mutual influence between dynamic changes of wetland landscape patterns and other land use classes. This study recommends that:
1) Niger Delta wetlands should be made to meet nature’s needs and be consistent with sustaining resilient and functioning ecological systems.
2) The importance of wetland must be recognized and governments at all levels must understand and value its role in creating a sustainable and resilient future for the country.
3) Well-founded steps should be taken immediately at federal, state and local government levels to value wetland appropriately, and promote its wise use and conservation by establishing appropriate wetland conservation guidelines and practices for Ramsar guidelines on restoring wetlands ecosystem.
4) Links between ecosystem services and national policies need to be strengthened so that the values of wetlands are better captured and disseminated through all levels and sectors of government. This will require specific guidance aimed at high-level governmental decisions and policy-makers.
5) Future wetland ecosystems should consider more nuanced and targeting questions on ecosystem services in order to overcome the potential data limitations identified in this study and to provide more robust information to inform on-going decision-making.
Acknowledgements
Our special thanks goes to USGs Center for archiving SRTM data in the public domain and the NASA team for their support. This paper reflects the collective experiences of the authors gained through their research, and through interactions with colleagues.
The satellite imageries were also analyzed using GIS and Remote Sensing methods by computing Normalized Differential Vegetation Index (NDVI) values for the entire study area by conversion of spectral reflectance values into NDVI values.