Foreign Direct Investment and Manufacturing Sector in Sierra Leone: A Vector Auto-Regression Analysis Approach ()
1. Introduction
1.1. Overview of the Study
For most developing countries, FDI is absorbed as an important element in their strategy for economic development. This is probably due to the fact that FDI is seen as a consolidation of technology, capital, marketing and management. According to [1] Oluchukwu, et al., one of the most uninteresting features of present day’s globalization drive is mindful reassurance of cross boarder investments, more especially by multinationals corporations (MNC). The global economy is witnessing an incredible upsurge in FDI since the beginning of 21st century to present and attracts most analysts’ attention. That is the reason why a good number of policy makers viewed FDI as a major impetus to economic growth in both developing and developed countries [2].
It is apparent that FDI can influence key issues such as shortages of capital, technological know-how, financial resources, skills, and fostering links with local firms that are vital for the economy. This has made FDI a center of attention for policy makers in developing countries and Sierra Leone is not an exception. In Sierra Leone foreign aid has also played a positive role in economic development, which might have its own impact on FDI [3].
Following a steady growth until 2012, foreign direct investment (FDI) was severely impacted by the Ebola outbreak in Sierra Leone. Investment flows hit their lowest level since 2010 with USD 129 million in 2017, however they picked up in 2018 to reach USD 599 million [4]. After so many years of restricting FDI, Sierra Leone like any other developing countries [5], seeks to attract external investors and spends large sums of money on infrastructural development projects like electricity, good roads and water supply system to entice foreign firms. According to Duramany-Lakkoh [6] Sierra Leone has attracted lots of international attention in promoting trade and investment after the civil war in 2002.
1.2. Sierra Leone Manufacturing Sector
The manufacturing sector in Sierra Leone economy is extremely volatile. As at 1970, the contribution of the manufacturing sector to the GDP was 5.5% and since then, value addition has been falling and fluctuating gradually over the years. The manufacturing sector contributed 26.42% to the economy in 2002 after the war, but fell to its lowest at negative 7.12% in 2014, basically because of the Ebola outbreak.
While the country’s manufacturing sector struggles with limited number of companies to compete with imported goods, the manufacturing sector is one of the key sectors in the Sierra Leone economy [7]. The real economy registered the highest growth of 20.72% in 2013 at a time when the country was described as having the fastest growing economy in Africa. But this was halted following the outbreak of the Ebola epidemic, which resulted in the economy recording a negative growth rate of 20.5% in 2015. After the end of the epidemic, growth has been picking up gradually [8]. Alongside economic growth, the manufacturing sector recorded the highest growth rate of 16.4% in 2006 and has been slowly recovering since. Contribution of the manufacturing sector to economic growth between 2012 and 2017 ranged between 1.63% and 2.04%, which has evidenced the growing concern in Sierra Leone about the slow development of the sector [9].
This study attempts to analyze the impact of foreign direct investments (FDI) on the manufacturing sector in Sierra Leone for the period of 1970 to 2018. FDI is often compared with foreign portfolio investments (FPI). The transfer of capital for securities, stocks and bonds that are short term and which are largely worrying the financial markets is the FPIs [10]. Many countries are determined to attract FDI in the manufacturing sector because of its admitting advantages as a tool of economic development.
1.3. Statement of the Problem
Sierra Leone government has laid much emphasis on manufacturing sector due to the fact that it has visualized the modernization of the sector that needs a deliberate and sustained application and contribution of management techniques, sustainable technology and other resources to move the economy to a more automated and efficient system of mass production of goods and services from a traditionally low-level productivity. The performance of the manufacturing sector in terms of output registered −17.12% in 2014 and also registered 0.37% in 2015, 4.81% in 2016, 4.94% in 2017 and 3.25% in 2018. The manufacturing sector output has been improving gradually and the GDP contributions have been fluctuating tremendously since 2001. The Sierra Leone GDP has been resilient since 2016 after the significant downturn of −20.49% in 2015, this has preceded with government efforts to attract investment inflows by making Sierra Leone an investment destination that is safe.
The majority of the population relies on subsistence agriculture and more than 50 percent of government revenue comes from foreign aid [11]. Recent government efforts to fight corruption and develop the industry seem to be successful and the country is expected to keep current pace of expansion. Nevertheless, there is still heavy signal of high unemployment rates with low per capita incomes in the economy of the country. All these, are economic inconsistencies, from which FDI is theoretically assumed to be the remedy. Therefore, there is need to assess the distinctive role and impact of FDI on manufacturing sector output in Sierra Leone.
1.4. Motivation of the Paper
Foreign direct investment (FDI) severely impacted by the Ebola outbreak in Sierra Leone after a steady growth in 2012. FDI volatile flows habitually attributable to the operations of mining multinational enterprises in Sierra Leone, with record high reinvested earnings of USD 562 million. FDI stocks is said to have increased significantly to USD 2 billion in 2018 [4].
Traditionally, Sierra Leone’s main investors are Belgium, Nigeria, Germany, Sweden, Mauritius, and the United States, but China is becoming a major investor.
Nevertheless, the lack of infrastructure, the slow legal system, the shortage in skilled labour, political violence and serious social disorder due to socio-economic disparities and the high level of corruption, are major obstacles to FDI. Sierra Leone was ranked as 163rd out of 190 countries losing 3 spots in comparison with the ranking in 2018 [12].
Most research work on FDI in the African perspective, has focused on the macroeconomic motives and determinants for FDI inflows into developing countries. Likewise, the empirical literature between FDI and the manufacturing sector growth in developing countries is indistinct [2] and precise in the perspective of Sierra Leone economy no study has been undertaken on the impact of FDI on manufacturing sector regardless of massive inflows of FDI being absorbed in the sector in Sierra Leone.
This research is also vital as it includes external debt as a variable under study since most developing countries like Sierra Leone had somehow been into that situation or bounded in the scenario of external debt projection. Notwithstanding all of that, in a nutshell this study will contribute extensively to the existing literature by providing current empirical evidence concerning the FDI output driven hypothesis within the manufacturing sector. In addition, the result of this paper possibly will serve as a principal terrain in devising new agendas for FDI policies in Sierra Leone. For that reason, given the previous discussion about the facts on FDI, it is worthwhile to embark on a study of assessing the impact of FDI on the manufacturing sector in Sierra Leone.
1.5. Research Objectives
Various prominent economists have conducted their study regarding the impact of the FDI towards the manufacturing sector and the results vary from one another. Hence, this study will investigate the relationship between FDI and the manufacturing sector by using the econometric model and the time series data to test the impacts of FDI in the manufacturing sector. This study will be carried out based on the following objectives.
1.6. General Objectives
To assess the relationship between FDI and the manufacturing sector output in Sierra Leone over the period of 1970-2018.
1.7. Specific Objectives
1) To examine the short-term and long-term relationship between FDI and other variables in Sierra Leone for the period of 1970-2018.
2) To examine the pros and cons of FDI on the manufacturing sector output in Sierra Leone.
1.8. Research Questions
This research will be looking at the following research questions:
How does FDI impact the manufacturing sector and other macroeconomic variables in Sierra Leone.
What are the pros and cons of FDI on the manufacturing sector output in Sierra Leone?
1.9. Research Hypothesis
The following research hypothesis will be tested in this study:
H0: There is no relationship between FDI and the manufacturing sector in Sierra Leone.
Leone in both the short-term and long-term.
2. Literature Review
2.1. Theoretical Literature Review
FDI was initially believed to move from a country with low interest rate to those resilient higher interest rates. This however inadequately explains the justification for investments across borders, since there had also been FDI transactions from higher interest (rates) countries to those with lower interest rates. The theory of FDI provides explanation therefore, why firms go against market elements in order to carry-out business in foreign markets and nations. Hymer [13], with a breakthrough came up with the industrial organization perspective which is the oligopolistic theory. He stressed that the movement of capital in admiration to FDI is not related with higher interest rates, but owing to the financing international operations, hence, market structure and competitive conditions which are relevant determinants of FDI flow. Hymer [13] declare in conclusion that international production has considerable negative impacts on the host economies, subsequently it increases concentration, limit the ability of the government to precise control over national economy, raises market barriers, and may put at risk both national productive and innovative products on the global demand.
Firm’s market position and firm-specific advantages have been engaged in order to provide explanation for the reason why MNCs engage in cross-border investments. These advantages are required to outweigh the disadvantages that are met by the MNCs when competing local firms.
Hymer’s theory [13] does not contempt location advantages, but rather regards it as exogenous factor related to the MNC’s behavior. Kindleberger [14] further extended the industrial theory of FDI; in their studies, they tried depart from perfect competition as the factors that influences FDI, nonetheless stressed on the disadvantages of perfect competition related to cultural and geographical alterations that the MNEs will envisage in their operation, when compared to domestic firms. Embarking on the technological advantage normally penetrates some intangible rent yielding assets such as brands and management skills, which they alleged to provide such advantages. It becomes imperative to state that FDI involves cross-border movement of various kinds of resources in terms of process technology, management skills, marketing, product and distribution of technical skills, marketing distribution of technical skills and human capital. In a simple term, FDI includes a movement of intangible assets such as technological know-how globally and incapability to look into the technological skill can advance undervalue the importance of FDI as an engine of growth for the recipient countries.
Hicks [15], proposed the accelerator theory of investment that an increase in the rate of output of a firm would need a proportional increase in its capital stock. The theory suggests a direct relation between the capital stock and the flow of output, and this was termed capital out ratio.
Smith [16] argues that there are three sources of growth which include, growth in labour force and stock of capital, improvement in the efficiency of labour and capital through greater division of labour and technological progress, promotion of trade that widens the market and widens the other two sources of growth. Smith postulated further that technological development is significant in the improvement of productivity and thus innovation is a very vital tool for the development to propagate.
For the supply of capital to increase, the interest rate has to be low. Smith [16] also pointed that the rate of profit generation is vital and a strategic factor in the economic growth process. Smith stresses on the point that the rule of economic progress would only rise if the rate of investment increases. In Smith’s view again, capital growth has been perceived as relevant for growth to take place, in which is it linked to investment. A country will suffer the ravages of stagnation if it is subjected to a fixed capital stock. He continued that savings would facilitate investment by considering private profit and the rate of interest. In the assertion of Duramany-Lakkoh [7], higher profits are vital for growth to take place particularly when they are re-invested.
In this theory, Aliber [17] pursues to determine why usually foreign assets are paid in local currencies when they produce abroad by their firms. The theory claimed that foreign firms take advantage of the strong local currency to acquire ownership of assets in host country due to their weak currencies.
The study according to Aliber [17] was more favourable to FDI in capital-intensive industries but was biased towards the service sector. Aliber [17] was also of the impression that fluctuations in the foreign exchange market that result in overvaluation or undervaluation making the MNCs advance in the sale or purchases of foreign assets.
That notwithstanding, Aliber’s theory [17] pursued to expound MNCs through financial market dealings such as market preferences and exchange rate risks for holding assets denominated in selected currencies. According to this postulation, therefore it is the financial market that facilitates a firm to have advantages over host countries and is relevant to all firms whose borrowing and as well as assets which are built in as much as this postulation offer some valuable insights about the movement of FDI. Coase [18] in his literature established the origin of this theory, in his market failure argued that transaction costs on foreign activities enables a firm to be more conducive to create an internal market as oppose to entering foreign markets. The idea has been expanded further by Buckley and Casson [19], which examine the choice between establishing a subsidiary and exporting in a major export location. FDI’s growth can be a feasible alternative for an MNC having an edge in relation to competitive advantage over other firms.
The impact of MNCs as a path for global change has been examined by Rugman [20], who lengthy the internalisation theory and encompassed FDI as a probable instrument. This firm-specific advantage seeks to be preserved by the organisational structure, and by inference, FDI should become favourable when the benefits of internalisation offset its costs. As he continued, internalisation is obliging in bypassing capital market imperfection, bringing about internal markets, the significant of the MNC concept, highly consistent with the transaction cost and eclectic theories. Also, the marketing phase will be controlled and managed by the producing firm; there will be no intermediate sales or Value Added tax. Internalization incentive advantages are to protect or exploit market failure [21].
In the theory of FDI macroeconomic theory is regarded as a milestone which was launched by Kojima and Ozawa [22]. The earlier theories discussed were largely considered investing abroad for US firms, distinguishing the Japanese FDI from them. The latter theories are mainly trade oriented and are in line with the comparative advantage of the principle dictates. On the other hand, US activity was generally an oligopolistic market structure. For instance, Dunning [21] suggested that Kojima’s [22] neo-classical framework was insufficient to capture the impact of firm-specific advantage in determining FDI flow. Consequently, when exports grow FDI is characterized as welfare-improving and trade-creating. As a result of Kojima’s preference for Japanese style management, his approach has been considered to be partial and insufficient. There were fewer stresses on trade and activity that was directed on firm-specific profit orientation. Export-oriented FDI occurred in countries with a comparative advantage for the host country as Kojima’s approach projected. He further claimed that Kojima’s [22] theory is totally insufficient in elucidating modern trade; for instance, it could not provide sufficient reason for trade flows, that are built fewer on the factor endowments distribution, and to exploit more on the need of product differentiation, economies of scale and other indicators of market failure [21]
2.2. Empirical Literature Review
Over the past years Foreign Direct Investment contribution to the economy has been widely discussed. The discussion has covered all economies. A number of scholars have explored the reason behind the existing relationship between FDI and its contributions to the growth of any economy. The empirical studies have found therefore inconclusive evidence when assessing the theoretical impact of FDI and growth of the economy. Some of the studies suggested that FDI has a positive impact of growth, while others have suggested on the contrary.
Bajo-Rubio and Sosvilla-Rivero [23] examine the inflow of FDI into the Spanish economy during the period 1964 to 1989 and using autoregressive distributive lag technique. Their study established a long-run connection between GDP and FDI, trade barriers, inflation and capital stock. According to Sun [24], in investigating the macroeconomic impact of FDI on China for 1979-1993 found that FDI contributed positively to Chinese domestic capital formation, exports, industrial growth and employment creation. Owing to the data limitation faced by the study, he pooled cross-section and time series data at the provincial level and formulated a regression model to test the hypothesis. Sun [24], practicalised the Generalized Least Squares (GLS) method and the study institute that FDI had pointedly contributed to the economic development of China. The FDI impact was seen as the main contribution it had to domestic capital formation, exports and promotion of industrial production, the creation of new employment. Sun [24] additionally stated that FDI contributed greatly to financial and physical capital development and did encourage local investment. Afolabi et al. [25], in his study examines the link between FDI and the value-added to the manufacturing sector in Nigeria. His study employs the autoregressive lag distribution technique to examine the relationship between foreign direct investments and manufacturing value added, it was established that in the long run, FDI have a negative effect on the manufacturing sub-sector in Nigeria. He continues however that the presence of multinationals in the host economy should be able to influence the private investment on their economy. Furthermore, these investments should be directed to other sectors where the existence of comparative advantage is clear, in order not to wear away the wherewithal of nationals. In his conclusion, he suggested that foreign private investment should supplement the production efforts of the labour force in the host country, in term of technical know-how, skills and wages. Ekanayake et al. [26] using the granger causality test prove the relationship between, inward FDI, export and output level across the developed and developing countries such as Brazil, Chile, Mexico, Canada, and U.S from 1960 to 2001. The research pointed out that the results are not consistent across these countries. Essentially, a two-way causal relationship between inward FDI and exports is found in the U.S and Canada and the presence of a one-way, moving from inward FDI to export is established in Brazil, Chile and Mexico.
Marwah & Tavakoli [27] pointed the effects of FDI and imports on economic growth in four ASEAN countries. In their study, they instituted the elasticity of the probable production function of FDI to be relevant in explaining all the four countries’ economic growth. The likely foreign capital elasticity was found to be 0.086 though import added 0.443 to growth in the case of Malaysia. They cogently established that both FDI and imports had a heavy impact on growth. In his study of the relationship between FDI and the manufacturing output show that there is no long run relationship between FDI and GDP in the manufacturing sector over the sample period of 1980 to 2005. Hooi [28], in his empirical results suggested that there is also no concrete evidence of any relationship running from the increase in FDI to GDP growth or increase in GDP to FDI growth in both short and long run. Generally, the empirical results inferred that, there was independent relationship between FDI and growth of the Malaysian manufacturing sector.
Various outcomes regarding the relationships may have been the result of using different methodologies, sample size and partly due to the amount of combination where majority of the studies were linking FDI to total economic activities such as the growth of the nation dignified by GDP. Moreover, in their empirical study of the causal relationship between FDI and economic growth, Sridharan et al. [29] establish that the relationship is bi-directional. This simply means that the growth leads to increased levels of FDI inflow and concurrently FDI is responsible for growth. Similarly, the growth impact of FDI has been depending on the institutional and policy environment of the receiving country (Vadlamannati and Tamazian [30] ). In their study they found that FDI could further promote growth in line with the new growth theory. They also contended that the process of capital inflow and accumulation in the beneficiary nation via FDI is expected to generate non-convex growth by encouraging the incorporation of new economic input and adoption with regards transfer of foreign technologies into production functions of the recipient economy. Iram and Muhammad [31] in their exploration empirically explored the impact of services and manufacturing Foreign Direct Investment (FDI) on economic growth in the presence of macroeconomic instability and privatization over period of 1972 to 2008. When they wanted to find out the order of integration, they utilized in their study ADF and Philip Peron unit root tests and Autoregressive distributed lag model (ARDL) between the variables to determine the robustness of their long-run relationship. In their study, they found that in the long run manufacturing FDI and services FDI significantly affect economic growth. Nevertheless, in the short run, both manufacturing FDI and services FDI do not considerably affect economic growth. Furthermore, the size of services sector FDI was found to be greater than manufacturing sector FDI.
The paper by Jayawickrama and Thangavelu [32] examined the influence of FDI on manufacturing growth of Singapore using a panel data sample of 14 manufacturing industries over 30 years stretching from 1975 to 2008. They found a positive concurrent effect of FDI on the output growth of Singapore manufacturing industries where 1 percent increase in FDI tends to increase manufacturing output growth by nearly 0.4 percent via controlling for unobserved industry characteristics and time effects. They observed also positive impact of FDI on manufacturing output growth using Arellano-Bond GMM estimator that controls for the endogeneity problems in the estimation. Their findings were substantiated by Fernandez and Paunov [33] who surveyed the impact of substantial foreign direct investment (FDI) inflows in producer service sectors on the total factor productivity (TFP) of Chilean manufacturing firms. Positive effects were got in firm fixed effects instrumental variables regressions and showed that forward linkages from FDI in services explain 7% of the observed increase in Chile’s manufacturing users’ TFP. Their findings also recommended that service FDI fosters innovation activities in manufacturing. Furthermore, they displayed that service FDI offers prospects for straggler firms to catch up with industry leaders. Gee et al. [34] in their study using the Autoregressive Distributed Lag (ARDL) model to examine the impact of FDI inflows from China, Japan, European Union, the United States, and ASEAN in relation to the growth of the manufacturing sector in Malaysia for period 1991 to 2006. They found that there are both short- and long-run bond between FDI inflows from European Union countries, ASEAN countries, and the United States with the growth in Malaysia’s manufacturing sector. The long-run elasticity revealed that FDI inflows from China, the United States, and the European Union countries had a positive impact on the growth in the manufacturing sector in Malaysia. Nevertheless, they also found that FDI inflows from Japan and ASEAN countries were negatively related to the growth of manufacturing sector’s output. Their results suggested that FDI inflows from developed countries to the R&D intensive sectors create positive impact on the growth of Malaysia’s manufacturing sector via transfer of technology possibly.
3. Methodology
The Vector Auto Regression (VAR) is the model adopted for this study. The VAR is used to assess the impact of FDI on the manufacturing Sector output of Sierra Leone and the Augmented Dickey-Fuller (ADF) and the Philip Perron (PP) test of stationarity was carried out as a result of the unit root properties presence, which is usually related with time series data. The Johansen Co-integration test was undertaken to check the long-run stability between the variables, and the Vector Error Correction Model (VECM) was employed also to estimate both long-run and short-run relationship between the FDI and the other variables.
3.1. Model Specification
The Functional form of the equation is shown as:
(1)
The Econometric form of the equation can be written in a VAR format as:
(2)
The log stochastic form of the equation can also be shown as follows
(3)
The VAR model in its implicit form is given as:
where:
LMQ = Log of Manufacturing Output,
LFDI = Log of Foreign Direct Investment,
LINF = Log of Inflation,
LER = Log of Exchange rate,
LDET = Log of External Debt,
LXPT = Log of Export,
WD = War Dummy,
εt = Error Term independent white noise process,
n = Lag length,
t = the linear trend and,
= Estimation Parameters.
Each of the variables in the VAR model, serves as the dependent variable in each of the equations while the regressors in all the equations are lagged values of all the variables. An unrestricted VAR with lag length n can be expressed below:
(1)
(2)
(3)
(4)
(5)
(6)
The environment for every VAR has an equation for each of the variables; where the manufacturing sector output as the main interest in the equation is the dependent variable and as well as the lags of all the variables that are independent variables. The p-values are not presented in the VAR estimates in order to test for corresponding parameters. It is how ever easier to determine whether or not a lagged variable has a significant adjusted (partial) effect on the corresponding dependent variable by each of the t-statistics values. Based on the t-statistics values display from the VAR estimates, disclose that only the first lag of outputs of each dependent variable is significant to explain variability in the independent variables output while the lag two (2) of the independent variables are not significant. Nevertheless, the R2 of the VAR model is determined at 94.9056 percent indicating that the model of the study was fitted well. The model also determines the adjusted R2 at 91.8490 (0.918490) percent which implies that the variability of 8.151 percent in the manufacturing sector output were not observed in the VAR model especially those that are received from other factors. The diagnostic tests carried out showed that the residuals found in the model were not auto correlated or serial.
3.2. Data and Sources
The data employed for this study is obtainable from World Development Indicators (WDI) database, Statistics Sierra Leone and the Bank of Sierra Leone. The data covered the period 1970 to 2018.
The choice of the period is in order to suit the estimation procedures. The available data the data on MQ and FDI, was obtained from Statistics Sierra Leone (SSL). The data on DET and INF was obtained from the World Development Indicators. While XPT was obtained from the World Bank and the data for ER was obtained from Bank of Sierra Leone (BSL).
All variables are transformed to natural logarithm form (ln). All variables are transformed to natural logarithm form (ln). This is important to prevent auto correlation error in vector auto regression analysis, using lag selection criteria like Akaike’s information criterion (AIC) and Schwarz’s information criterion (SIC).
In order to avoid spurious results, all variables need to be tested for stationarity using the Augmented Dickey-Fuller and the Philip-Perron tests.
The stationarity or Unit Root test is necessary to enable one determine the order of integration of the variables. Having established their order of integration, the next step is to ascertain the existence of a long –run relationship among the variables.
The most popular method of determining long run relationship is the cointegration technique by Johansen, [35] and Johansen & Juselius, [36]. This technique requires among other things, variables should be integrated of the same order.
After establishing cointegration, an error correction estimation is done to enable the determination of the long run and short run equations, together with the identification of an error correction term.
The next and final step after the estimation is the conduct of a diagnostic test to ascertain the closeness of the model in line with the classical linear regression model assumptions.
3.3. Definition and Justification of Variables
In this study the dependent variable is the manufacturing output growth (MQ). While the Explanatory variables are defined as Foreign Direct investment, inflation, nominal exchange rate, external debt and exports value.
3.3.1. Manufacturing Output (MQ)
The manufacturing sector remains one of the vital sectors that propels economic development in most of the developing countries in which Sierra Leone is not an exception. From simple, slow-growing and low value activities where it acts as the transformation catalyst of the economic structure of countries to a more productive activity [37]. A boost in manufacturing production offers prospect of economic growth, which serve as an engine of growth and the speed of development can be enhanced with the availability of manufactured products. Furthermore, the output of the Sierra Leone manufacturing sector has been very sluggish over the years.
This can be known when comparison is made with other sectors of the economy. This trend and structure linked with the Sierra Leone manufacturing sector, together with its impact in solving problem of poverty most especially is questionable. There has been series of unstable kind of growth and fluctuations experienced in the Sierra Leone’s manufacturing sector which has reflected on the Gross Domestic Product (GDP) share and to the economy as a whole.
3.3.2. Foreign Direct Investment in the Manufacturing Sector (FDI)
FDI is a direct investment by an enterprise involved in the production of goods and services which is located in other country or engaged in expanding businesses already available in the country [38]. They assumed some of the reasons for FDI special investment privileges such as tax exemptions offered by the host as incentives for investment or to gain tariff free access to the markets of the country or region, taking advantage of cheaper labor in the host country [38]. There have been indecisive literatures concerning FDI and growth relationship with that of the specific sector. However, when FDI is expected to shows a positive and significant relationship on growth when relates with domestic investment, export performance and exchange rate [39], found a positive significant relationship on growth.
In general, foreign direct investment normally brings in the necessary liquidity in the sector to give room for expansion that will increase growth in different sectors of the economy. On the other hand, as well, FDI inflows may infer negative growth prospects if there is a substantial reversal flows for instance if the MNCs obtain significant tax concession from the host country or profit remittances and dividends. Therefore, the likely sign is negative, that is β1 < 0.
3.3.3. Inflation—GDP Deflator (INF)
Inflation is a serious issue in an economy and the manufacturing sector which is a subset of the economy is not an exception. Inflation is the rate at which the general level of prices for goods and services is rising, and, as a result the purchasing power is falling or, it can be the on-going fall in the general purchasing power of the monetary unit [40]. The higher rate of inflation in the local markets makes domestic goods more costly. This implies that the inputs for the manufacturing sector will become expensive and this will ultimately retards growth. On the same note manufacturing produce or services become very expensive to foreigners and hence there will be fall in demand for manufacturing exports, holding piles of inventory will not be worthwhile thereby affecting growth.
In addition, due to high domestic prices of which consequently domestic goods and services are now dearer, the local residents will as a result prefer to buy foreign goods and services instead, and this infers a falling demand for local manufacturing sector produce. The collective effects of dwindling demand, expensive inputs and costly manufacturing sector produce, thus sinking growth. The inflation sign is likely to be negative, that is β2 < 0.
3.3.4. Exchange Rate (ER)
The interface between the demand for and supply of foreign exchange is called the exchange rate. The adjustment of the exchange rates in order to balance the demand for foreign exchange depends primarily on the residents’ demand for domestic goods and services. Exchange rate is defined as the price of one currency in terms of another [41]. The exchange rate connects the price systems of two different countries that enables the possibility for global trade to make straight comparison of goods traded. In other words, ER joins domestic prices with global prices. Oladipupo [42] discoursed that there are ripple effects on other economic variables such as inflation rate, interest rate, money supply, unemployment, etc. as result of movements in the exchange rate.
The economic wellbeing of every Country that’s gives an open door to global trade in goods and services must stress on the significance of exchange rate as a variable to be reflected under this study. This is as a result of the fact that the manufacturing sector growth is destined to be affected by fluctuations in the exchange rate in either positive or negative. Since the exchange rate is stable, thus it is expected affecting the economy negatively; that is β3 < 0.
3.3.5. External Debt (DET)
Gross external debt at any given time is simply the actual current liabilities balance outstanding that require repayment of the principal and interest at some point by the debtor that owed to nonresidents of an economy [43]. The relevant needed of foreign resources inflow for growth, employment and investment stimulation in the economy manufacturing sector and as well as the general economy in total will be hindered greatly. This also simply infers on the other hand that the funds which the country has to use in order to extend production or investment for the repayment of both the loans and the interest accumulated.
There is quite scarce of literatures relating to the empirical part on the relationship between government external debt and the manufacturing sector growth. The effect on the overall economy growth is drawn as a result of the sector specific effects of debt on growth. According to Reinhert and Rogolf [44], external government debt has a negative impact on growth. He also seems to point towards debt and growth being having a negative relationship, with the debt Laffer curve and as well as the debt overhang theory to provide this negative relationship evidence. Therefore, the expected sign is negative as follow β4 < 0.
3.3.6. Exports
Exports have to do with goods and services that are produced in one country and then transmitted to residents in another country, which can be used as a measure of openness of an economy. There is obvious significance for the role of exports in growth of both the economy and manufacturing sector.
There exist enormously different positions that can be taken at the theoretical level, such as the argument of the standard neoclassical trade, a substantial positive impact of exports and trade on economic performance would be postulated due to a well distribution of resources. When look at the manufacturing sector, increased export performance will suggest evidence the degree of openness to trade in the economy and as well as better market of manufacturing produce outside the economy. Barro [45] who promoted the endogenous growth theory, state that, an open trade as one of government policies, would infers exports, in which the country’s long-term growth rate could be stipulated, so is the manufacturing sector, and as a result the expected sign is positive. That is β5 >0.
3.3.7. Error term
The Error term as a variable in this study captures the errors that might have occurred during data gathering and as well as the effects of all other variables left out of the model, for instance variables that cannot be easily quantified but affects manufacturing sector output growth.
3.3.8. Word Dummy
Sierra Leone as a country has endured civil war which lasted for 10 years from 1991 to 2002. The Dummy variable has been included to capture the impact of the decade long period of war. 1 represents the impact of war from 1991 to 2002 and 0 for otherwise.
3.4. Estimation Procedures
3.4.1. Stationarity Test
A stationary process involves one whose statistical properties over time remain constant. In addition, a strictly stationary stochastic process means that all moments of all degrees of the process, for instance variance, is the same anywhere [46]. Testing the stationary properties of time series is an essential exercise because, the use of non-stationary time series data in Classical Linear Regression Model (CLRM) often leads to production of fraudulent regression and as well as magnified results. The unit root test is carried to examine the stationarity of variables using the Augmented Dick-Fuller test (ADF) and the Philip Peron (PP) test in order to assess the order of integration of each time series. The statistical inference on stationarity is to be considered at 1%, 5% and 10%.
3.4.2. Model Estimation
The VAR model is estimated using EVIEWS 9 software
3.4.3. Diagnostic Tests
After estimating the model, diagnostic tests are conducted to assess the suitability of the model in line with the classical linear regression assumptions. The most important of these are: stability, normality, Ramsey RESET Test, Heteroscedasticity and autocorrelation.
4. Estimation and Analysis of Results
This part employs the methodology that was crafted in the methodology section in order to obtain the empirical results from the estimations. The presentation of unit roots test uses both ADF and PP tests in order to identify the stationarity of variables, regression results, granger causality, Error correction model, and diagnostic tests as well as the interpretation of results. The econometric package called e-views was used to determine the relationship between the variables. The results obtained are the basis for giving the ultimate conclusions and policy recommendations.
4.1. Unit Root Test
Prior to model estimation, unit root tests are conducted and the results are shown in Table 1 and Table 2.
From the results in Table 1, with or without trend, all our variables are not stationary at the levels except log of External Debt. Apart from the External Debt, all other variables are stationary only at first difference, which are integrated of the order one or I (1) while the log of External Debt is integrated of the order zero or I (0).
With regards to the homoscedastic error term assumption that is inherent in the ADF approach, we also employed the Phillip-Perron test in order to address the weaknesses that are associated with the assumption’s restrictiveness of the approach of the ADF test. The results of the Phillips-Perron test are presented in
![]()
Table 1. Results based on the ADF approach to unit root test.
Source: EViews computations
![]()
Table 2. Results of the Phillips-Perron (PP) Unit Root Test.
Source: EViews computations
Table 2.
As per result obtained in Table 2 above, the Phillips-Perron test both at the levels and at the first difference confirmed the results we obtained under the ADF approach. That is to say, all our variables also are not stationary at the levels except for log of External Debt which are stationary at level but all other variables are stationary only at first difference. The fact that only one variable, log of External Debt) is integrated of the order zero or I (0), all other variables are integrated of the order one or I (1). This makes the model for the study more appropriate for the Johansen co-integration test, since the Johansen test assumes that all the variables are integrated of the order one or below.
On the bases of these results, we can now go ahead to compute the cointegration.
4.2. Diagnostic Test
4.2.1. Stability Test
Source: EViews Computation. No root lies outside the unit circle. VAR satisfies the stability condition.
4.2.2. Figure 1 Stability Test for
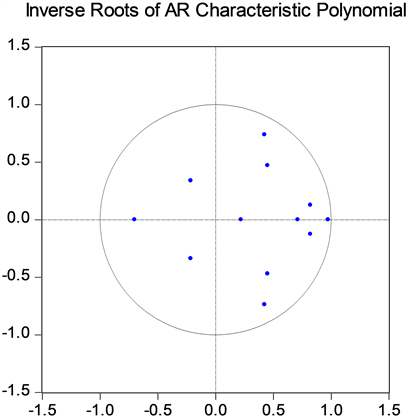
Source: EViews Computation.
Results from Table 3 presents data from VAR estimations, also translated to Figure 1, shows the graphical representation of the AR roots using a complex coordinate system. It elucidates that the VAR model does not have any root outside the unit circle which indicate that VAR satisfies the stability condition.
4.2.3. Lm Test for Serial Correlation (See Table 4)
![]()
Table 4. LM TEST FOR SERIAL CORRELATION.
Source: EViews Computation; Probs from chi-square with 36 df.
4.2.4. Normality Test
Source: EViews Computation.
The results for the Normality Tests which uses the Skewedness and Kurtosis are shown in Table 5 above. The result of the Jarque-Bera is the combination of the p-values of both the Skewedness and Kurtosis.
4.2.5. Heteroscedasticity Test
Source: EViews Computation.
Looking at the results from the diagnostic checks in Table 6 above indicate that, the diagnostic tests result on normality, prove that the residuals from the null hypothesis are multivariate normal. But the result displayed by Jarque Bera proved that the p-values are less than 1% (p-value = 0.0000) which means that the model is not normal. Also, the result displayed that there is no serial correlation at lag order ‘h’, while Heteroskedasticity also has no cross terms only have levels and squares since the p-value is 37%, this means that the model is homoscedasticity. All the diagnostic tests carried out in this study indicate that our model is very robust. Looking at the parameters for the study, LFDI at the 5% level of significance, can negatively impacts the manufacturing sector output. Inflation will normally arise as a result of significant increase in price devoid of an equivalent increase in the consumer purchasing power which reflects to wages increase and a subsequent budget size increase. Exchange rate and debt is induced by the government policies, political instability and restrictions which negatively affect the manufacturing sector output in the country.
4.3. Co-Integration Test
The next step after testing stationarity of each time series, we now search for co-integration between the variables. Co-integration is conducted on the variables with the same order of integration with the dependent variable as its condition. We employed in this study the Johansen Jeselius [35] technique in order to examine the probable existence of a long run equilibrium [35] and [36]. Again, Johansen [35] method offers for the parameters of long run relationship is an accurate estimate [47]. The meaning they will not wander away from each other since the variables seems to have a stable long run relationship. If cointegration exists in the time series, then the standard Granger causality estimates should include the error correction-term. It refers to a more formally to the error-correction model.
4.4. The Impact of FDI on the Manufacturing Sector Output Base on VAR Lag Length
Source: Eviews computation. *indicates lag order selected by the criterion; LR: sequential modified LR test statistic (each test at 5% level); FPE: Final prediction error; AIC: Akaike information criterion; SC: Schwarz information criterion; HQ: Hannan-Quinn information criterion.
As per the result in Table 7 above, each of the information criteria suggests the various lag lengths. We then test for co-integration between the independent variables and manufacturing sector using the Johansen cointegration approach. We used this approach since it is not sensitive to what is chosen as the endogenous variable. In order to select a lag length of two (2) to minimize information criteria, we make use of the all Criteria except Schwarz Information Criterion which selected a lag length of one (1).
4.5. The Impact of FDI on the Manufacturing Sector Output Base on VAR Estimates
Summarized VAR Estimates on the Impact of FDI on the Manufacturing Sector Output
From the VAR result in Table 8, MQt−1 = −0.093259LFDIt−1 + 0.392362LINFt−1 − 0.795185LERt−1 + 0.016594LDETt−1 − 0.013439XPTt−1 + 0.146285WD
R2 = 0.949056, adjusted R2 = 0.918490. The adjusted R2 (0.918490) shows that there is no autocorrelation. The coefficient of determination, R2 at 94% suggests that 94% of the changes in LMQ are explained by changes in LFDI, LINF, LER, LDET and LXPT. The variables that are absent in the model can be explained by the remaining 6%. The F-statistic is 31.04914 is displaying that the variance of estimate has a significant difference with the variance of the independent variables. The t-values for the regression coefficients are all positively and statistically significant except for LINF and LDET which display negative signs.
4.6. The Impact of FDI on the Manufacturing Sector Base on Unrestricted Cointegration Rank Test
Johanson Cointegration Test
The test results for Johansen cointegration based on the trace statistic is presented in Table 9 while the results based on the maximum-eigenvalue test statistic is presented in Table 9. As per results in Table 9, the null hypothesis of no cointegration at the 5% significance level is rejected, given the highly significance p-value (0.0000) and with the trace statistic of 95.75366. Looking at the maximum-eigenvalue test statistic in Table 5, the null hypothesis of no cointegration is rejected as well. Therefore, this infers that there is cointegration between the independent variables and the manufacturing sector.
Both trace and maximum Eigen statistics reject the null hypothesis of no cointegration at the 5 per cent significance level, indicating there is long run equilibrium
![]()
Table 8. Dependent variable: D (LMQ)-1 (Lag one).
Source: EViews computation.
![]()
Table 9. Unrestricted Cointegration Rank Test (Trace).
Trace test indicates 2 cointegrating eqn(s) at the 0.05 level. *denotes rejection of the hypothesis at the 0.05 level; **MacKinnon-Haug-Michelis (1999) p-values; Source: EViews Computation.
Max-eigenvalue test indicates 2 cointegrating eqn(s) at the 0.05 level; *denotes rejection of the hypothesis at the 0.05 level; **MacKinnon-Haug-Michelis (1999) p-values. Source: EViews Computation.
relation between the independent variables and the manufacturing sector output in Sierra Leone over the sample period from 1970 to 2018. Since there is cointegration existing amongst the variables, the causality specification is estimated using the error correction term. The estimated VAR for Granger causality analysis are reported below.
4.7. The Impact of FDI on the Manufacturing Sector Output Base on VAR Result of Standard Granger Causality Tests
VEC Granger Causality/Block Exogeneity Wald Tests
The results of causality analysis are summarized in Table 10 and Table 11, only two tables are shown, the remaining tables are display in appendix. As per the
![]()
Table 10. Result of standard granger causality tests.
Source: EViews Computation.
results, the causality result shows that LFDI greatly influence LMQ at 1%. Since LMQ is the dependent variable, increase in LFDI, will increase LMQ as well and as LMQ increases LFDI increases also within the country. Furthermore, this result fit in to the theory of eclectic paradigm which states that the investors seek for low labour cost. Since the country is gifted with much of labour, however, they can attract more LFDI. Utmost importantly, LINF also influences LMQ. This result displays that there is a significant relationship between LMQ and inflation in at 5%, which implies that LMQ and LINF can granger cause. The result also shows that LMQ and LER Can also granger cause each other. This implies that positive relationship exists between LMQ and LER in the country. Additionally, there is no directional relationship between LDET AND LXPT with LMQ. This implies that LMQ cannot granger cause LDET and LPT individually but it can granger cause them all in totality. There is also positive relationship existing between LFDI and LER only. This means that LFDI can granger cause LER but cannot granger cause LINF, LDET and LXPT as individually, but can granger cause them in total. This implies that government policy on business and the environment can inspires investors greatly. From the results, the dependent variables granger causes all the variables in total, all things being equal, this will invariably enhance economic growth in Sierra Leone.
4.8. Vector Error Correction Model (VEC)
4.8.1. Result of the Long-Run Estimates
Result on the impact of FDI on the agricultural sector, having controlled for the other variables, is presented below:
Impact of FDI on Manufacturing Sector output based on Vector Error Correction Estimates
From Table 12, the estimated function for long-run VEC equation is shown as:
The result in Table 12 shows that manufacturing sector has long term relationship with LFDI, exchange rate and external debt but not with inflation and export. As per the result, inflation and export have negative impacts the manufacturing sector output. That is, an increase in inflation by 1% causes the manufacturing sector output to fall significantly. The finding cannot be surprising when consider the fact that most of the manufacturing sector outputs in the country are imported. Since Sierra Leone’s economy is open to attract investors in the country. Exchange in the long run enables more foreign trade to Sierra Leone with new technology from abroad to boost the manufacturing sector output. Furthermore, having established the cointegration, we proceed to analyses the short run dynamics by using the vector error correction model (VECM). The results are presented in Table 13 below.
![]()
Table 12. Result on long-run VEC estimate.
Source: EViews Computation.
![]()
Table 13. Result for short run VEC estimate: D (Lmq-1) as dependent variable.
Source: EViews Computation.
4.8.2. Short-Run Dynamics for the Impact of Manufacturing Sector Output
Impact of FDI on Manufacturing sector output, results based on VECM
The Estimated function for the Short-run VEC equation is shown as:
The results from Table 13 above are shown only for the dependent variable LMQ (−1) and the lags of the independent variables. The remaining equations are display in the appendix. The results show that the coefficients of lagged LFDI and LER, above all, the first lag of both LFDI and LER are positive. Which suggest that the value additions in the manufacturing sector output are impacted by LER and LFDI positively. In the short run, the manufacturing sector output improves by 0.88% when FDI changes by 1%. We do not find log of external debt, log of export and log of inflation to be significant with the manufacturing sector output in the short run.
4.9. Interpretation of Econometric Results
The following equation was obtained via substituting the regression results in the linear model:
4.9.1. Constant (C)
There is no coefficient of the constant that reflects the MQG of manufacturing sector in Sierra Leone.
4.9.2. Foreign Direct Investment (FDI)
From the results above, FDI is at 1% level of significance. It has 0.093259 positive coefficient. The result implies that manufacturing sector output increase by approximately 0.09 units is induce by a unit change in FDI, holding the effect of all other explanatory variables constant or ceteris paribus. The acquired results infer that a percentage rise in FDI improves the output in the manufacturing sector as redirected by the coefficient being positive. Hence, the manufacturing sector output (MQ) bears an association that is positive with the foreign direct investment, which implies that FDI is vital for manufacturing sector output.
4.9.3. Inflation (INF)
From the results above, Inflation was also at 1% level of significance. The results display that the inflation has −0.392362 negative coefficient. This result infers that, a unit change in inflation will subsequently result in a 0.392362 unit in manufacturing output reduction. The results shown are line with the presented expectation of the negative relationship between the MQ and the inflation rate.
4.9.4. Exchange Rate (ER)
The variable of the exchange rates is at 1% level of significance with 0.795185 positive coefficient. This implies that a unit change in exchange rate will lead to an approximately 0.8 units increase in manufacturing sector output, ceteris paribus or holding the effects of other explanatory variables constant. Therefore, the result implies that increase in exchange rate is costly as it makes raw materials expensive and at the same time reduce manufacturing sector output export earnings. Therefore, manufacturing sector output will be reserved despite a positive relationship between manufacturing output and exchange rate.
4.9.5. External Debt (DET)
The result showed that the External Debt is at 1% level of significance with −0.016594 negative coefficient. This result solicits Rogolf’s [44] hypothesis. The 0.017 coefficient indicates that manufacturing output will approximately fall by 0.017 units which is prompted by a unit change in external debt. The results infer that, an increase in external debt will results to lack of capital available for production and as well for investment purposes in the long run for the economy of Sierra Leone. High loan repayments as well as high costs of servicing the debt are as a result of large external debt. Hence, there will be decline in the manufacturing output since only few funds will be directed to production. The results are also speculating about the huge external debt that Sierra Leone is having or is engrossed to. This has posed difficulties for Sierra Leone to obtain loan from either World Bank or IMF due to her high burden of external debt. The results obtained are line with the expectation derived in chapter three that there is a negative relationship between manufacturing output and external debt.
4.9.6. Exports (XPT)
From the result displayed above exports are at 5% level of significance with 0.013439 positive coefficient. This implies that, a unit change in exports will prompt a 0.013439 unit’s change in manufacturing output (MQ). This result is in supports of the argument of standard neoclassical trade which hypothesize a substantial positive impact of exports and trade on economic performance as a result of better resources allocation. These results also solicit the endogenous growth theory of Barro [45] and as well others as well, declare that the government policies, which has to do with open trade, such as exports, and this will specify the long-term growth rate of the country and as well as the manufacturing sector output.
5. Summary
In a nutshell, the study found that there exists a positive relationship between foreign direct investments and manufacturing Sector output. Thus, there is a positive impact of FDI on the manufacturing sector. Therefore, the hypothesis that there is no relationship between FDI and manufacturing output is basically rejected.
6. Conclusions
The paper aimed at assessing the impact of FDI on the manufacturing sector output in Sierra Leone, the regression results show that, FDI have an influence on the manufacturing sector output as far as the F-test is concerned; this has to do with the overall test for significance. The results show as follows that:
FDI is positively related to the manufacturing sector output and it is statistically significant at 5%. This implies that the higher the inflows of FDI the more the manufacturing sector output as well.
The results also show that in the first lag, manufacturing sector output has positive contribution to all the variables though its contribution is very little to some variables like inflation and debt as indicated by its estimated co-efficient.
The empirical results overall imply that, there is independent relationship between FDI and the manufacturing sector output of Sierra Leone.
Result from studies identified the challenges that exist in order to augment the impact of FDI on the manufacturing sector which has to do with the agencies of related government. Governance enforcement is together with business operations restrictions due to the regulatory barriers, capital flows restrictions and ethnicity-based ownership restrictions in terms of corruptions and bureaucratic levels. It is therefore important for the Sierra Leone government to take into account the paramount role of FDI and also improve the business environment by creating an investment destination that is safe and friendly. This required government to formulate policies that are bias free and create a business environment that can inspire investors greatly. This calls for government to strengthen the implementation of reforms which will improve the country’s gross domestic product (GDP), while embarking on severe infrastructural development and curbing inflation via strengthening monetary policy.