Multivariate Spatial and Temporal Analysis to Study the Variation of Physico-Chemical Parameters in Litani River, Lebanon ()

1. Introduction
River water continues to be able to sustain all human beings and other organisms for centuries. [1] Water quality is an important factor in determining environmental change, closely associated with social and economic development. [2] [3] [4] Currently, surface water pollution has received an attention around the world. The main causes of degradation of surface water quality are natural and anthropogenic activities, such as hydrological features, climate change, precipitation, agricultural activities and wastewater discharges from industries. [5] [6] [7] [8] Water quality of many large rivers in many countries has deteriorated considerably as a result of these anthropogenic activities in recent decades. [9] [10] Several studies on the identification of the nature and sources of contamination of many rivers have been conducted over the last decades. [11] [12] [13] [14] [15] In this context, different systems based on physical, chemical and biological methods have been studied and applied for the treatment of river surface water contamination such as coagulation and membrane filtration (micro and ultrafiltration), adsorption, advanced oxidation, photocatalysis and other methods. [16] [17] [18] [19] [20] The selection of the method used in the treatment system is based on the nature and the concentration of the identified contaminations. However, in surface water quality management, the treatment cost may be as important as the achievement of water quality goals. Therefore, efficient management of water resources requires information about the variability of the river and surface water quality. [21] [22] [23] [24] Spatial analysis of the quality of river water is important to identify the black points of pollution, where the contamination sources are concentrated, and therefore achieve the cost optimization of the water treatment. However, seasonal variations, such as temperature and precipitation, affect the water quality of the river and lead to different attributes between seasons. [15] Thus, analysis of samples from different locations (spatial studies) at different seasons provides an overview of the seasonal evolution of the ecosystem and therefore improves the management of the river and surface water treatment. However, seasonal variations, such as temperature and precipitation, affect the water quality of the river and lead to different attributes between seasons (Hayek et al. 2018). Thus, analysis of samples from different locations (spatial studies) at different seasons provides an overview of the seasonal evolution of the ecosystem and therefore improves the management of the river and surface water treatment.
Litani River is the largest and the most important river in Lebanon. Litani basin forms an equivalent of 20% of Lebanon’s area. [25] Litani River forms a lifeline for the industrial and agricultural sectors in Bekaa and Southern Lebanon areas. In addition, the river provides the portable water and the energy production in these regions. Several studies on the water quality of Litani River have been conducted. The studies demonstrate that the quality of the water in the river have been deteriorated due to industrial, agricultural and sewage water pollution. [25] [26] [27] other studies have been performed at a long duration (11 years) and have evaluated the evolution of the water quality of the river. These studies are concentrated at the lake Quaroun. [15] The quantity of water discharged from the basin is equivalent to 24% of the net rainfall received by the entire Lebanese territory; this quantity represents more than 40% of the total amount of running water in the internal rivers. [25] This characteristic of the Litani River in addition to the previous works has demonstrated the impact of the environmental factors on the water quality. Therefore, there was not much work that relates the spatial and the temporal seasonal variation of physicochemical parameters in the Litani River and especially on several sites. The purpose of this article was to evaluate the level of different physicochemical parameters in terms of space and season in the Litani River. The application of different multivariate methods such as cluster analysis (CA), principal component analysis (PCA), multivariate analysis of variance (MANOVA) has been used extensively in recent years to analyze environmental data. [28] [29] [30]. The use of MANOVA presents an important advantage in spatiotemporal modeling because with such models and dimensionality, we will obtain an estimation of the realistic propagators. Spatiotemporal analyses were proved to have additional benefits over purely spatial or time-series analyses. They may allow us to simultaneously study the persistence of models over time and illuminate any unusual models. When included, the space-time interaction terms may also detect data clustering that may be characteristic of emerging environmental hazards or persistent errors in the data recording processes. In this article, the results of analysis of selected samples are to examine the quality of the water and evaluate the pollution status of the Litani River between various sites. The relationship between sampling sites and the identification of water quality variables responsible for spatial and temporal variations in water quality were studied.
2. Materials and Methods
2.1. Site Selection
Three sites have been selected in Litani basin for the sampling to achieve the spatial study, Jeb-Jenine station, Lac Quaroun and Quasmieh. The Selection of these sites is due to two main concepts; the first one is the stationed distribution of zones, at the upper (Jeb-Jenine station), the middle (Lac Quaroun) and the bottom (Quasmieh) of the river (See map of sampling sites in the Litani River Bassin). The second concept is due to the importance of the three zones, while Jeb-Janine station is located in the zone complex industries and huge population, the second is the Lac of Quaroun, the only lac in Lebanon and divided it into two parts, and the last one is the Quasmieh Station located near the sea, and it is a zone of restaurants and agricultural activities.
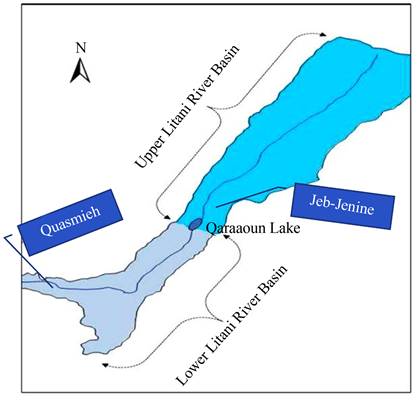
Mapof sampling sites in the Litani River Bassin
2.2. Site Description
Jeb-Jenine (Upper Litani River), with the coordinate: N33˚38'331'' E35˚46'79'', with elevation above the sea level equal to 920 m. Jeb-Jenine is the largest and most populated town in its district.
Quaroun Lac (Middle of Litani River), with the coordinate: N 33˚32'918'' E 35˚41'765'', with elevation above the sea level equal to 864 m. Quaroun is the biggest lac in Lebanon with the total capacity of 220 Million cube meter.
Quasmieh (Lower Litani River), with the coordinate:
N 33˚19'773'' E 35˚15'613'', with elevation above the sea level equal to 4 m.
2.3. Sampling Test
All samplings were taken from the same points in the three stations. The same sampling method was used for all samples, 2 m from the side, 20 cm deep from the free surface of the water. Each sample consists of 5 trials, while each measurement was performed 5 times and the average is recorded. These samples were taken at the beginning of each month.
2.4. Measurement Method
The parameters, the location of the measurement, the analytical method used, the period, the date and the numbers of samples are summarized in Table 1. The samples were monitored and measured from the first of January 2018 until the first of December 2018 every month.
2.5. Data Analysis
The obtained results of all studied parameters were analyzed using statistical
![]()
Table 1. Description method of sampling of parameters.
methods. All statistical analyses were performed using the statistical software ElliStat, R (4.0.2). However, in this article, several dependent variables were measured for each sampling unit instead of a variable thus the multivariate analysis of variance (MANOVA) determine if the average vectors of several groups (sites) were identical or not i.e. in statistical terms, test whether the variables or the physicochemical parameters differed significantly from one group to another. The Principal Component Method (PCA) is used to extract different factors that reduce the contribution of the least significant variables [31].
In addition we use the factorial analysis (FA) whose main objective is to transform the original variables into new uncorrelated variables, called factors, which represent linear combinations of the original variables. So FA is a data reduction technique that suggests the importance of varieties to explain the observed variances in the data. This method provides the important factors that generally represent about the same amount of information as the set of initial observations. FA can be written by relation 1:
(1)
where Fi is the factor i (factor number),
is the loading vector, Y, is the measured matrix value of the variables, j is the sample number and k is the total number of the observed variables. Then after define Fi we can write the factor score in the equation 2:
(2)
where M noted by measured variable, beta is the loading factor, S: factor score, e: residual terms or error of the model.
In order to apply the discriminant analysis (DA), we must first classify stations by groups (clusters) using the Cluster Analysis (CA). In this article, we use (DA) to determine the water quality parameters that significantly contribute to group separation. The technique of this method is based on the construction of a discriminant function (DF) for each group forward stepwise, and backward stepwise [32]. This function is a linear combination of variables and is calculated using the following function:
where i is the number of groups (G), ai is the constant inherent to each group, n is the number of parameters, wj is the weight coefficient, assigned by DA to a given selected parameter (pj) [33].
Also, we evaluate in this study the water quality of the Litani river by using the National Sanitation Foundation-Water Quality Index (NSFWQI) in three selected sampling sites.
The NSFWQI formula is as follows: [2]
(4)
NFSWQI: water quality index (0 - 100);
Wi: weight of intended factor (0 - 1);
Qi: sub-index resulted from quality index curves (0 - 100) (Table 2).
3. Results and Discussions
3.1. Spatial and Seasonal Analysis
3.1.1. MANOVA and PERMANOVA Statistical Method
In this section, the parameters were analyzed in more detail in different stations by using the MANOVA and PERMANOVA multivariate statistical techniques to explore temporal and spatial variations. The non-parametric “Kruskal-Wallis H” tests showed that the water quality parameters were significantly different among the sampling months (p < 0.05). Kruskal-Wallis test (Table 3) were performed to compare the water quality parameters among the different sampling stations and revealed that except for temperature, all other parameters were significantly different (p < 0.05). Also we used the non-parametric “Mann-Whitney U” test (Table 4) showed that among the 11 water quality parameters, one (temperature) is significantly different between the 2 seasons (p < 0.01), whereas the other parameters were not significantly different with regard to seasons (p > 0.05).
![]()
Table 2. Water quality index values of rivers.
![]()
Table 3. Kruskal-Wallis test. Grouping variable: Station.
![]()
Table 4. Mann-Whitney test. Grouping variable: Season.
Also, the statistical difference between the three different stations (Quaroun, Jeb-Jenine, Quasmieh) were tested by using a statistical method Permutational Multivariate Analysis of Variance, “PERMANOVA”, which based on “Bray-Curtis” resemblance matrix of square-root transformed data (Anderson, 2001). [34] We interest in this article, to test the differences of the quality water between the three stations in Litani River, for that we analyzed the density data by using the one-way PERMANOVA which based on the Euclidean distance matrix of untransformed data (Figure 1). For all the PERMANOVAs, p-values were obtained from 9999 permutations. The Monte Carlo tests were also considered in case of low numbers of unique permutations. Also, the PERMANOVA results were visualized by non-metric multidimensional scaling (nMDS) ordinations performed on the Bray-Curtis similarity matrix applied to square root transformed data. The statistical analyses (univariate PERMANOVA and pair-wise t tests) showing significant differences among stations.
In Figure 2, the multivariate PERMANOVA showed a significant “par x Site” effect (p < 0.001) and pair-wise comparisons showed highly significant differences between. In agreement with PERMANOVA results, the points are separated in the nMDS representation, confirming that composition and structure of the parameters of the stations strongly differed among the three sites.
3.1.2. Spatial Statistical Analysis
The average of each parameter, the standard deviation and the range calculated from the values obtained from the different stations of Litani River are summarized in Table 5. The results were performed using MANOVA analysis discussed above. The obtained values are compared to the WHO limits.
A description of the geological feature of Litani River is necessary to understand the difference between the values of the studied parameters. Litani River flows from north to south in Bekaa valley, therefore from Jeb-Jenine and inflow
![]()
Figure 1. Schematic diagram of geometric partitioning of the water quality parameters in the three stations (g = 3) for one-way PERMANOVA in two dimentional (bivariate, p = 2) Euclidean space.
![]()
Table 5. Descriptive statistics for the parameters in the three different stations.
![]()
Figure 2. Stations variations likely physicochemical parameters
in Lac Quaroun. The dam stores the water in the lac and the flow stops in the wet season (the upper basin of Litani River). The river feeds from other tributaries, the most important is Ein El-Zarka, and continue to Quasmieh (the lower basin of Litani River).
The observed deviation around the mean, for the parameters represented in Table 3, is substantially high and random; this could be due to seasonal changes and different human activities surrounding the stations. In addition, we remark in the table, the average temperature of the water ranged from 19.5˚C (Quaroun) to 20.17˚C (Jeb-Jenine) with a maximum of 26˚C (Quasmieh) and a minimum of 16˚C (Quaroun). We know that the temperature variation is usually influenced by precipitation. Based on the results the temperature slightly increased during the dry season. So we can deduce that the temperature on all stations sampled is relatively homogeneous.
High average concentrations of ammonia, Sulfate and Phosphate, 9.28, 60.33 and 2.73 mg∙L−1 respectively, were observed in Jeb-Jenine station. These values indicate a high agricultural, industrial and sewage water pollution in the area. Jeb-Jenine is located in the middle Bekaa valley. This area is characterized by high agricultural and industrial activities. The three values overshoot the WHO limits for river water quality. The high standard deviation value represented by the table for the three parameters is due to the fact that these values are highly affected by the seasonal parameters. The average concentrations of the three components decrease in Quaroun Lac. This decrease is due to two reasons, the first is the very low agricultural and industrial activities in Quaroun region and the second is the other tributaries that feed the river located between Jeb-Jenine and Quaroun especially in the wet season. The values of the average concentrations of ammonia, sulfate and phosphate are very low at Quasmieh point. This is due to the fact that the two basins are separated for a long period each year in addition to the low agricultural and industrial activity in south Lebanon region. The concentration of ammonia is very close to the WHO limit (<0.2), whereas that of sulfate is under the WHO limit.
The pH results show no remarkable variations with mean pH values ranging from 7.73 (Jeb-Jennine) to 8.54 (Quaroun). The maximum pH value is 10.4 at the Quaroun station during the dry season is above the limit of WHO of river guidelines (6 - 9), and with a minimum value of pH equal to 7.1 in Quaroun and Jeb-Jenine stations during the rainy season.
Dissolved oxygen (DO) is the most fundamental parameter in the study of water quality that has an important role for water quality analysis which is a vital indicator of physical activity, chemical and biological process of water bodies. A low DO rates were observed in Jeb-Jenine and Quaroun lac for values of 2.83 and 5.18 mg∙L−1 respectively. Otherwise, high average nitrite concentrations were observed in these two stations for maximum of 1.0 mg∙L−1 in Jeb-Jennine and 7.4 mg∙L−1 in Quaroun station compared to a low concentration in Quasmieh station for a maximum value of 0.14 mg∙L−1. The low DO and the high nitrite concentrations indicate high bacterial and biological activities in the two stations, Jeb-Jenine and Quaroun, and a low activity in Quasmieh.
Salinity, conductivity and TDS values are related to the concentration of ions in the water. As a result, high average values of the three parameters were observed in Jeb-Jenine station where the very high concentrations of sulfate, phosphate, and nitrite were observed. The averages of the three parameters surpass the WHO standards especially for the electrical conductivity. Otherwise, low averages were observed for salinity, electrical conductivity and TDS in Quaroun lac and Quasmieh station. The obtained values for the three parameters are lower than WHO standards.
3.1.3. Seasonal Statistical Analysis
Physico-chemical property of water is affected by environmental factors especially temperature and pressure. To study the seasonal evolution of physico-chemical parameters, the samples were divided into two groups according to the temperature and the precipitation of the month. Six samples were taken in dry months characterized by high temperatures and low precipitation, whereas, the other six samples were taken in wet months characterized by low temperature and high precipitation. The results are summarized in Figure 3. An increase in the total dissolved oxygen was observed in all stations during wet season because of the fresh water reaches the river with runoff. The same observation was detected for TDS, electrical conductivity and salinity in the three stations during the same period. This observation is related to the fact that runoff increase the erosion rate and therefore carries high amount of ions to the riverbed, especially, magnesium, sodium, potassium, carbonate, bicarbonate and chloride, which increase water turbidity. The more important evolution of the three parameters was observed in Quaroun Lack for a change ranges between 25% and 30%. The high evolution is due to the geographical feature of the region located between Jeb-Jenine and Quaroun that is formed of a series of highlands and hills more close to the river stream and contain several tributaries flow in the wet season.
The concentration of ammonia does not show an important evolution in Quaroun and Quasmieh stations. Otherwise, a very important evolution between the wet and the dry season was observed in Jeb-Jenine stations. Jeb-Jenine is a very important agricultural region. Therefore, in addition to the high concentration of ammonia, present in fertilizers, that is detected in Jeb-Jenine station, the average concentration increases between dry and wet season from 7.57 to 10.98 mg∙L−1. The high concentration of nitrite in Jeb-Jenine and Quaroun stations indicates a high bacterial activity in these two regions. The bacterial activity increases in the dry season in Jeb-Jenine. The average concentration of sulfate increases in the three stations in the wet season. The most important increase from wet to dry season is observed in Jeb-Jenine station for a rise of 50%, from 40.32 mg∙L−1 to 80.33 mg∙L−1. This increase of sulfate concentration is related to a development in the industrial activity around the river basin during the dry season (especially in summer). Phosphate concentration increases in wet season in Jeb-Jenine station due to the runoff. Otherwise, an increase of the concentration of phosphate was observed in the dry season in Quaroun and Quasmieh that is due to the tourist activity in restaurants located on the river boundaries.
3.2. Physico-Chemical Parameters: Correlations
3.2.1. Principal Component Analysis (PCA), Statistical Method
We interest in this section on the Principal component analysis (PCA) methods to extract key factors. As show in the section 1, we know that the component
![]()
Figure 3. Seasonal evolution of the different physico-chemical parameters.
loadings are the linear combinations for each principal component, and they express the correlation between the original variables and the newly formed components. In general, the component loadings are used to determine the relative importance of a variable compared to other variables in a principal component. There exist a various approaches to choose the number of component loading, such as the eigenvalues greater than 1 were used as a cut-off value to determine the number of factors. Firstly for the wet season, the first four principal components had eigenvalues greater than 1 and explained approximately 90% (Table 6) of the cumulative variances in the original dataset.
Secondly for the dry season, also the first four principal components had eigenvalues greater than 1 and explained 91% of the total variances in the original dataset. We notice that the first axis or factor (F1) explained 53% of the total variance, so it’s remarkable that this factor present a strong positive loading for conductivity, TDS, salinity and ammonia but a weak negative loading for PH, DO and Nitrate (Table 7). Factor 2 (F2) explained 15% of the total variance and
![]()
Table 6. Wet season PCA: Total variance explained.
![]()
Table 7. Dry season. Extraction method: Principal component analysis.
had a strong positive loading for Nitrite, sulfate and phosphate. Factor 3 (F3) explained 13% of the total variance and had a strong positive loading for Nitrate. Factor 4 (F4) explained 11% of the total variance and had a strong positive loading for Temperature and pH.
In the wet season (Table 8), Factor 1 (F1) explained 43% of the total variance and had a strong positive loading for Conductivity, TDS and Salinity. Factor 2 (F2) explained 23% of the total variance and had a strong positive loading for Nitrite and sulfate. Factor 3 (F3) explained 14% of the total variance and had a moderate positive loading for Ammonia, and a strong positive loading for phosphate. Finally, Factor 4 (F4) explained 10% of the total variances and had a strong positive loading for temperature and moderate for Nitrate.
3.2.2. Correlation between the Different Parameters, Statistical Analysis
Table 9 and Table 10 provide the correlation matrix between the water quality parameters for both wet and dry seasons, respectively. The tables were made using PCA method. According to Pejman et al. (2009) [35], when the coefficient of correlation is greater than 0.75, the water quality parameters were considered to be significant parameters for water quality monitoring. The significant water quality parameters that should be used to measure the seasonal variation in water quality of the Litani River are showed in the next section by using MANOVA method. The correlation coefficients of pH with Ammonia and PO4 were −0.551, −0.626 and −0.315 during the wet season, respectively. However, during the dry season, no correlation coefficients between pH and other parameters were shown. DO is correlated with Conductivity, TDS and Ammonia during the wet
![]()
Table 8. Wet season. Extraction method: Principal component analysis.
![]()
Table 9. Correlation matrix of the water quality parameters in wet season.
![]()
Table 10. Correlation matrix of the water quality parameters in dry season.
season to a significant degree (p < 0.01) and (p < 0.05), whereas in the dry season, Nitrate is more correlated with DO (r = 0.662) to a significant degree (p < 0.01). Salinity correlated with PO4 (r = 0.608) in the wet season but the Salinity correlated with Ammonia, Nitrite and PO4 in the dry season. TDS values recorded during the dry season correlated with nitrate (r = 0.512), PO4 (r = 0.592), Ammonia (r = 0.87), and Salinity (r = 0.952) to a significant degree (p < 0.01). In contrast, wet season TDS values were positively correlated (p < 0.05) with PO4 (r = 0.578) and Ammonia (r = 0.658) and Salinity (r = 0.732).
Very high correlation between salinity, electrical conductivity and TDS is expected. The three values are affected by the concentration of ions in the water. This relation explain the high values of these three parameters in Jeb-Jenine station where the concentration of phosphate, sulfate, nitrate and ammonia are very high compared to the low values in the two other stations. Another strong negative correlation between the concentration of phosphate and ammonia with the dissolved oxygen (DO) has been demonstrated by Hayek et al. [15] Eutrophication, is a phenomena where an excessive growth of plants and algae occurs in the water because of the availability of nutrients especially phosphate and nitrogenous products. As a result, a high decrease of the concentration of dissolved oxygen is observed in water. Consequently, very low concentration of DO was detected in Jeb-Jenine station where the concentration of ammonia and phosphate are very high. The high correlation, discussed above, between ammonia, TDS, conductivity and DO, observed in wet season, is related to the fact that the values of these parameters increase due to the runoff.
Nitrite is the most toxic components in the nitrogen cycle. It is the intermediate between ammonia and nitrate. The transformation of ammonia into nitrite is due to a bacterial activity. The availability of ammonia increases the bacterial activity in water and therefore the concentration of nitrite, and then a positive correlation was observed between these two components. The low dissolved oxygen inhibits the oxidation of nitrite into nitrate. Therefore, referring to the results in Table 3, a high bacterial activity is approved in Jeb-Jenine station and in Quaroun lac by the high concentration of nitrite for 1.024 and 1.040 mg∙L−1 respectively (100 times greater than that of WHO standard). The low concentration of nitrate observed in the two stations is due to the low DO amount. Otherwise, high concentration of nitrate and low concentration of nitrite were observed in Quasmieh station.
4. Conclusion
Samples from three locations at Litani River at dry and wet seasons were analyzed. The physico-chemical properties of the water processed were determined by different analytical methods. Multivariate analysis of the different parameters was performed. The statistical methods were helpful to analyze special and seasonal evolution of the water quality. MANOVA and PERMANOVA statistical methods show an important difference of water quality between the three stations. This difference is demonstrated by the major changes in the values of the parameters from one station to the other. Jeb-Jennine represents a main pollution area in the river. The high ammonia, sulfate and phosphate concentrations are evidence of important agricultural, industrial and sewage water pollution in the area. High bacterial activity was investigated in Jeb-Jennine and Quaroun stations from the high nitrite concentrations in the two locations. All parameters are highly affected by climate factors, especially temperature and precipitation. TDS, salinity, electrical conductivity and the concentrations of all pollutants increase during wet season affected by the runoff. The bacterial activity increases during dry season where the temperature is convenient. Other factors can affect the water quality of the river for example geographical features of the region and seasonal human activity like tourism. More details and values from these factors, introduced in the statistical techniques, will be helpful to improve the evolution of the water quality. The correlation between different parameters was evaluated using PCA statistical method. This correlation is not stable, and evolves between wet and dry season.
NOTES
*Corresponding author.