1. Introduction
Trace metals (TMEs) are among the natural substances that humans concentrate in their immediate environment. These inorganic pollutants are largely derived from industrial waste. Self-purification is also hindered by the presence of TMEs in water. TMEs cannot be degraded or metabolised and are an example of ultimate persistence [1] [2]. Amongst TMEs, arsenic, copper, cadmium, lead, mercury, nickel and zinc are those that have most severely affected the environment. It is well established that the presence of TMEs in the environment, even in moderate concentrations, is responsible for the production of a variety of diseases related to the risk of skin lesions, respiratory problems and cancer [3] [4] [5]. Mining, electroplating, metal processing, textile and battery industries are the main sources of TMEs. The World Health Organization (WHO) recommends a maximum acceptable concentration of 2 mg∙L−1 of copper in drinking water [6].
As the third most used metal in the world, after iron and aluminium, copper is nowadays in great demand in all sectors. As its use and production continue to increase each year, the amount of copper released into the environment is also increasing [7].
In Côte d’Ivoire, water pollution is mainly of domestic and industrial origin [8] [9]. Various classical techniques have been used to eliminate aqueous pollutants (precipitation, oxidation-reduction, reverse osmosis, filtration, electrochemical techniques, etc.) as well as the use of chemical products. However, some limitations appeared, including high operating costs, incomplete removal of metal ions, production of toxic sludge and the occurrence of carcinogenic effects on human health [9] [10] [11] [12]. The use of natural adsorbents for water treatment is therefore advocated. These have been reported in the literature by Tarley et al. [13] [14] and Dubey et al. [14] to be inexpensive, environmentally friendly and widely available materials for effective wastewater treatment. The removal of TMEs from aqueous solutions by adsorption on different natural materials, in particular on Moringa (bark, shells, powders), has been the subject of previous work [15] [16] [17]. However, no study has used unhulled Moringa oleifera seed powder as a natural adsorbent for the adsorption of TMEs. In this study, the adsorption capacity of unhulled seed powder was assessed. In addition, equilibria relating to the kinetics and thermodynamics adsorption were determined.
2. Materials and Methods
2.1. Chemicals and Reagents
All chemicals used were of analytical grade: hydrochloric acid (HCl) (37%, MERCK, Germany), copper standard solution (1000 mg∙L−1, GROSSERON SAS, France), nitric acid (HNO3) (65%, CHEM LAB, Belgium). Dilutions were made from copper standard solution with ultrapure water. The pH of solutions was adjusted with 0.1 M (NaOH or HCl) solution.
2.2. Types of Equipment
An analytical AND balance with a precision of 0.0001 g was used for weighing powders. An Atomic Absorption Spectrophotometer (AAS) (ICE 3500, ThermoFischer, France) equipped with a 10 mA CoCuMnNi hollow cathode lamp, an air-acetylene nebuliser assembly and a data processing software was used for copper determination. A pH meter (WTW, model pH7110, Germany) calibrated with buffer solutions pH 4.0; 7.0 and 10.0 was used. The experiments also required a water bath (MEMMERT, 10˚C - 95˚C), a magnetic stirrer (DLAB, 0 - 1700 rpm), and a centrifuge (ASTOR 8 NEW).
2.3. Preparation and Characterisation of the Adsorbent
Moringaoleifera seed powders were used as adsorbent (Picture 1). They were obtained from unshelled (GND: Picture 2(a)) and shelled (GD: Picture 2(b)) seeds. The method of preparation of Moringa seed powders, the identification of their different functional groups as well as their structural and morphological study were described in our previous article [18].
2.4. Adsorption Assays
Experiments were carried out with a copper solution mixed with an amount of adsorbent (0.5, 1, 1.5, 2, 2.5, 3, 3.5, 4, 4.5, 5, 5.5 and 6 g). The pH tested varied from 3 to 11 (3, 4, 5, 6, 7, 8, 9, 10 and 11) and the temperature from 20˚C to 50˚C (20˚C, 30˚C, 40˚C and 50˚C). After a contact time (5, 10, 20, 40, 60, 80, 120 and 180 min) between the copper solution and the adsorbent under stirring at
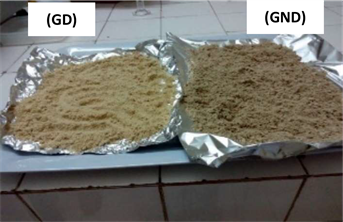
Picture 1. Moringaoleifera seed powders (GD on left and GND on right).
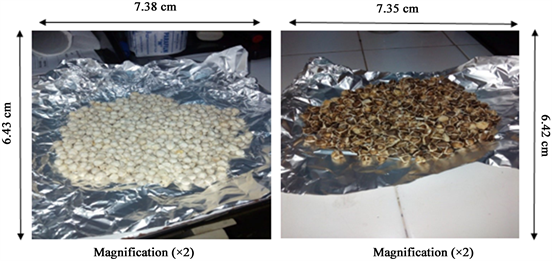
Picture 2. Shelled (GD) and unshelled (GND) Moringaoleifera seeds.
1700 rpm, the mixing was filtered through a Whatmann filter paper (250 mm) and the solution was centrifuged at 500 rpm for 3 min. The adsorbent dose, contact time, temperature and pH were optimized. Equilibrium copper concentrations were determined with the flame atomic absorption spectrometer at 324 nm. The adsorption efficiency (%) was calculated according to the following expression:
(1)
Ci: Initial copper concentration (mg∙L−1);
Ce: Equilibrium copper concentration (mg∙L−1).
The optimal conditions for the determination of copper were determined through the selection of optimal values for pH, equilibrium time, mass and temperature. These parameters allow the searching of the ideal medium for the adsorption phenomenon. The optimum pH obtained was 8, the equilibrium times were 20 and 40 min for GD and GND respectively. The optimal mass of GD and GND was 4.5 g and the temperature was 20˚C.
2.5. Adsorption Isotherms
Adsorption isotherms were determined with 4.5 g of adsorbent mixed with 50 mL of copper solution at different concentrations (5, 10, 20, 30, 40 and 50 mg∙L−1). The pH was set at 8 and the temperature at 20˚C, 30˚C, 40˚C and 50˚C. The equilibrium adsorption time of 20 min for GD and 40 min for GND was used. The experiments were carried out in batch mode. Langmuir, Freundlich and Temkin isotherms were used to determine the constants involved in the adsorption process. Equations (7), (8) and (10) show the Langmuir, Freundlich and Temkin equations respectively.
(2)
where KL is the Langmuir affinity constant and qmax (mg∙g−1) the maximum adsorption capacity.
Another important factor in the Langmuir isotherm is the separation factor (RL) which is used to assess whether the adsorption is unfavourable (RL > 1), linear (RL = 1) or favourable (RL < 1); and is calculated by Equation (8):
(3)
where KL is the Langmuir constant.
(4)
where KF is the Freundlich constant and 1/n indicates the degree of affinity between the adsorbate and the adsorbent; when 1/n < 1, the adsorption is favourable.
The linear form of the Temkin isotherm is given by Equation (5):
(5)
where B = RT/bT (J∙mol−1) is related to the heat of adsorption, R is the perfect gas constant (8.314 J∙k−1∙mol−1), T (K) is the absolute temperature, bT is the Temkin isotherm constant and AT (L∙g−1) is the equilibrium binding constant corresponding to the maximum binding energy.
2.6. Thermodynamic Data
Thermodynamic calculations were performed to determine the Gibbs free energy (ΔG), enthalpy (ΔH) and entropy (ΔS) changes.
(6)
(7)
where R (J∙mol−1∙K−1) is the perfect gas constant and T is the temperature (K)
2.7. Kinetic Studies
The adsorption kinetics experiments were carried out under optimal experimental conditions. 50 mL of copper solutions at various concentrations (10, 25, 35, 45 and 50 mg∙L−1) were analyzed at different contact times (5, 10, 20, 30, 40 and 60 min). Stirring of the mixture was performed at 500 rpm for 3 minutes. After adsorbent-adsorbate separation by filtration on a Whatmann paper (250 mm), the concentration of copper was determined by AAS at a wavelength of 324 nm. The adsorption capacity was calculated according to Equation (11):
(8)
where Ci is the initial copper concentration (mg∙L−1); Ce is the equilibrium copper concentration (mg∙L−1); m is the mass of adsorbent (g) and V is the volume of the copper solution (L).
The pseudo-first order [19], pseudo-second-order [20], intraparticle diffusion [21] and Elovich [22] models are presented in Equations (12) to (15) respectively.
(9)
where q𝑒 (mg∙g−1) is the amount of copper adsorbed at equilibrium, qt (mg∙g−1) is the amount of copper adsorbed at timet (min) and K1 (min−1) is the rate constant of the pseudo-first order model.
(10)
where K2 (min−1) is the rate constant of the pseudo-second order model.
(11)
where Kdi (mg∙g−1 min1/2) is the intra-particle diffusion constant and C (mg∙g−1) is the boundary layer thickness.
(12)
whereα (mg∙g−1∙min−1) is the initial rate of adsorption and β (g∙mg−1) the desorption constant.
2.8. Application of GD and GND Powders to Surface Water Samples
Surface water samples were taken in the towns of Ayame (Ayame River), Aboisso (Bia River) and Abidjan (Ebrie Lagoon on the side of Port-Boüet and Banco). Sampling was carried out according to the method described by the American Public Health Association [23]. Samples of water were packaged in 500 mL polyethylene containers with three containers per water point. Samples were immediately acidified with 1% nitric acid and stored in a cooler at 4˚C until analysis. All containers were thoroughly rinsed with ultrapure water. The quality of the water withdrawn was also measured. The different copper adsorption rates for GD and GND powders were calculated and the variation with the initial copper concentration in the water samples was determined.
3. Results and Discussion
3.1. Adsorption Assays
The calibration curve showed a linear relationship between absorbance and copper concentration with a coefficient of determination close to 1 (R2 = 0.9991).
3.1.1. Effect of Contact Time on the Adsorption of Cu2+
The contact time is one of the useful parameters for studying adsorption. It allows us to obtain the adsorption equilibrium time, which expresses the time after which the concentration of the adsorbate stabilizes. The evolution of copper concentration as a function of contact time is shown in Figure 1. The adsorption equilibrium times obtained were 20 and 50 minutes respectively for GD and GND powders.
From 0 to 10 min and from 10 to 20 min of contact time between GD powder and copper solution, a decrease in the initial concentration of the copper solution from 30 to 26 mg/L is observed. This could result in an occupation of the binding sites of the GD powder by Cu2+ ions. As these sites are no longer available, we notice a constancy of the copper concentration in the solution from 20 min. This phenomenon is also observed by Araújo et al. [24] who reveal an equilibrium time of 20 min after performing the adsorption of copper by GD powder in an interval of 5 to 50 minutes. The equilibrium time obtained with GND powder was 50 min. This could be explained by the fact that GND has a greater
![]()
Figure 1. Evolution of copper concentration as a function of contact time.
number of binding sites, but also by the contribution of the shells covering the kernels, which would have sites capables of binding metals. The equilibrium times of 20 min (GD) and 50 min (GND) obtained in our study are much lower than those obtained by Kalavathy and Miranda [25] who studied the adsorption of Cu2+ in the aqueous phase by activated charcoal from M. oleifera wood. These authors obtained an equilibrium adsorption time of 240 min. An adsorption equilibrium time of 60 min was found by Garcia-Fayos et al. [26] in their study on the use of Moringaoleifera seed pods as an adsorbent for copper removal. This difference could be explained by the nature of the adsorbents used, in this case activated carbon and Moringaoleifera seed pods, which would have a greater number of sites available for metal fixation than GD and GND powders.
3.1.2. Effect of Adsorbent Mass on the Adsorption of Cu2+
The optimum mass is an intrinsic parameter that reflects the mass of adsorbent that adsorbs the greatest amount of adsorbate in solution. The evolution of the percentage of adsorption as a function of the quantity of adsorbent is presented in Figure 2. It can be seen that the percentage of adsorption increases with the increase of the quantity of adsorbent. A mass of 4.5 g for GD and GND powders was obtained.
The percentage of copper removal by GD and GND powders increases from 0 to 20% as the adsorbent mass increases from 0.5 to 4.5 g, reaching a maximum rate of 20% at 4.5 g. When the adsorbent mass increases from 4.5 to 5 g, the percentage of copper removal by GD and GND powders decreases from 20% to 10%. Above the mass of 4.5 g, the concentration remains fixed. This means that the binding sites become saturated and increasing the amount of adsorbent does not increase the adsorption efficiency [27]. This observation is also made by Garcia-Fayos et al. [26]. However, unlike our study, these authors obtained a high percentage of copper removal (89.85%) for a small quantity of adsorbent (1 g) consisting of Moringaoleifera seed pods. This would be due to the difference in the adsorbents used [28]. Indeed, Moringaoleifera seed pods would have a greater
![]()
Figure 2. Evolution of the percentage of copper adsorption as a function of the adsorbent mass.
availability of active sites compared to GD and GND powders.
Above the mass of 4.5 g, the concentration remains fixed. Increasing the amount of adsorbent does not increase the adsorption efficiency. The binding sites become saturated [29].
3.1.3. Effect of pH on the Adsorption of Cu2+
Figure 3 shows the effect of pH on the adsorption process of copper by GD and GND powders.
The results showed a cascade of apparent periods of increasing and decreasing copper adsorption rate by GD and GND powders over the studied pH range from 3 to 12. Thus, an increasing adsorption rate (from 67.74% to 73% for GD and from 70% to 76.3% for GND) was observed for pH values ranging from 3 to 5, followed by a slight decrease observed (from 73% to 70% for GD and from 76.3% to 76% for GND) for pH values ranging from 5 to 6. A growth in the adsorption rate was again observed (from 70% to 77.41% for GD and 76% to 80% for GND) for pH values ranging from 6 to 8 followed also by a decrease in this rate (from 77.41% to 71% and 80% to 73%) for pH values ranging from 8 to 10. The adsorption rate remained constant in the pH range between 10 and 12. The results then clearly indicate that copper adsorption increases with the pH of the solution and stabilizes at pH 8.
In their study of Cu2+ adsorption by M. oleifera seed powders at pH 3 to 7, Farrokhzadeh et al. [29] reported a higher percentage adsorption (30%) at pH 7. Garcia-Fayos et al. [26] observed a lower percentage adsorption (2.27%) at pH 6 in their study on the adsorption of copper (Cu2+) by M. oleifera seed pods; but from pH > 6 this percentage reached a maximum of 55.98%. Kalavathy and Miranda [25] observed with activated charcoal from M. oleifera wood that adsorption was very low in the pH range from 2 to 4 (0.2% to 0.8%). By increasing the pH above 6, the adsorption capacity increased from 1% to 1.5%. However, in their work, an optimum pH was chosen (pH 6) because metal hydroxide precipitation was observed at pH above 6.
The pH appears to be one of the most important parameters for any adsorption
![]()
Figure 3. Evolution of the percentage of copper adsorption as a function of the pH of the medium.
process. The relationship between pH and metal removal could be linked, according to these authors, to the functional groups of the adsorbent used and to the nature of the mineral species in solution. Natural adsorbents, known as ion exchangers, contain mainly weak acid and basic functional groups. Adsorbent-metal bonding appears to be an ion exchange process involving electrostatic attraction between negatively charged amino acid groups and metal cations [30]. Thus, in the pH range from 2.5 to 7, a high number of hydrogen and hydronium ions compete with the copper metals for binding sites on Moringa powders, resulting in poor adsorption of this metal. While at higher pH values the competition is low, the reason is a lower number of hydrogen ions, a higher exposure of the ligands to negative charges, resulting in a higher adsorption of copper. At pH values above 8, there is no more precipitation in solution, thus causing a decrease in adsorption capacity [31].
3.2. Adsorption Isotherms
Adsorption isotherms play an important role in determining the maximum adsorption and the design of new adsorbents [32]. They indicate the relationship between the amount of copper adsorbed on the surface of GD and GND powders and the remaining copper concentration at solid/liquid equilibrium. The equilibrium results obtained in this study were evaluated using three isotherm models described by several other studies. These are the Langmuir, Freundlich and Temkin models. Figure 4 and Figure 5 show the graphical representations of copper adsorption by GD and GND powders obtained with these three models. The experimental equilibrium data for these models, including the Langmuir (KL), Freundlich (KF) and Temkin constants, are shown in Figure 4. The heat of adsorption constants (B), coefficients of determination (R2) and equilibrium adsorption capacities qe (mg/g) are presented in Table 1 and Table 2.
The coefficients of determination (R2) obtained attest to the applicability of the Langmuir isotherm model to fit the experimental data of copper adsorption by Moringa powders. This suggests that the adsorption of copper particles could be well represented by a monolayer adsorption model. Also, the essential characteristic of the Langmuir isotherm described by the separation factor (RL) [33] indicates that the whole process was favourable for the adsorption of copper on Moringa powders, as its value was between 0 and 1. Farrokhzadeh et al. [30], in contrast to our study, indicated that the Temkin isotherm was the best model for the adsorption of Cu2+ by M. oleifera seed powders. Indeed, they found a value of the heat of adsorption constant (B) of 24.98 much higher than ours in which B values varied from 0.03 to 0.142. The heat of adsorption constant describes the adsorption capacity. The higher it is, the greater the adsorbent-adsorbate interactions will be. The Langmuir, Freundlich and Temkin isotherm models were also studied by Kalavathy and Miranda [25] to describe the equilibrium data for the adsorption of Cu2+, Ni2+ and Zn2+ in the aqueous phase by activated charcoal from M. oleifera wood. These authors observed
![]()
Figure 4. Langmuir (a), Freundlich (b) and Temkin (c) isotherm models for copper adsorption by GD powders.
![]()
![]()
Figure 5. Langmuir (a), Freundlich (b) and Temkin (c) isotherm models for copper adsorption by GND powders.
![]()
Table 1. Adsorption parameters of Langmuir, Freundlich and Temkin isotherms for copper adsorption by GD powders.
respective coefficients of determination (R2) of 0.99; 0.97 and 0.98 demonstrating that the Langmuir, Freundlich and Temkin models described Cu2+ adsorption well. However, the (R2) values were higher in the Langmuir model for Ni2+ adsorption (0.997) and the Freundlich model for Zn2+ adsorption (0.995) compared to the other models. The Temkin isotherm had a high correlation coefficient for all metals (0.98).
Garcia-Fayos et al. [26] also noted that the equilibrium data for copper adsorption by Moringaoleifera seed hulls was best described by the Langmuir model. Indeed, the (R2) value was 0.947 and the maximum adsorption capacity was 13.089 mg∙g−1.
![]()
Table 2. Adsorption parameters of the Langmuir, Freundlich and Temkin isotherms for copper adsorption by GND powders.
Regarding the study of adsorption isotherms, the authors have generally noted that the value of the coefficient of determination (R2) is one of the important factors relating to the experimental data of the adsorption process. The Langmuir model assumes that adsorption is limited to a monolayer, whereas the Freundlich model is an empirical analysis describing the adsorption of solutes from a liquid onto the surface of a solid, thus assuming a heterogeneous adsorption surface. The Temkin isotherm assumes that the heat of adsorption of all molecules in the layer decreases linearly due to adsorbent-adsorbate interactions.
3.3. Thermodynamic Data
In order to determine the feasibility and thermodynamic nature of the adsorption process, the three basic thermodynamic parameters that are Gibbs free energy variation (∆G˚), standard enthalpy variation (∆H˚) and standard entropy variation (∆S˚) were determined. The thermodynamic equilibrium constants for copper adsorption were calculated according to Lyubchick et al. [34] by plotting ln(qe/Ce) as a function of qe. Then, the Gibbs free energy (∆G˚) was determined using equation (16) and the values of ∆H˚ and ∆S˚ were calculated from the slope and intersection of the plot of lnKd versus 1/T using relation (17). All these values have been illustrated in Table 3.
Table 3 shows negative values of ∆G˚ suggesting a favourable adsorption process of Cu2+ by GD and GND powders, also reported by Sherbinia et al. [35]. Moreover, the decrease in ∆G˚ values f rom −13,943 to −32,731 KJ∙mol−1 and from −18,186 to −31,839 KJ∙mol−1 for GD and GND respectively is accompanied by an increase in temperature from 20˚C to 50˚C (293 to 323 K). This indicates that the process is favourable at high temperatures.
The value of ∆H indicates whether the adsorption process is endothermic or
![]()
Table 3. Thermodynamic parameters of copper adsorption by GD and GND powders.
exothermic. In our study, these processes are endothermic due to the positive values found for GD and GND powders. The calculated value of ∆S˚ indicates a higher degree of freedom at the solid/liquid interface resulting from the adsorption of copper by the adsorbents.
3.4. Adsorption Kinetics
In order to investigate the adsorption mechanism and potential steps to control the reaction rate, kinetic models are used to test the experimental data [36] [37]. To this end, four models were applied in the present study to describe the mechanism of copper adsorption kinetic by GD and GND powders, namely the pseudo-first order model; the pseudo-second order model; the Elovich model and the intraparticle diffusion model.
Figure 6 and Figure 7 show the graphical representations of these models. The kinetic parameters of these different models, including the kinetic constants and equilibrium adsorption capacities qe (mg/g) are presented in Table 4 and Table 5. The t/qt versus time curve representing the pseudo-second order kinetic model gave a straight line passing through the origin as a function of the different experimental concentrations, thus reflecting a good proportionality relationship of the amount of copper adsorbed versus time. Furthermore, the calculated adsorption capacities (qe, cal) from the pseudo-second order plot are much closer to the experimental data (qexp, cal), reinforcing the applicability of this model. Therefore, in this study, the adsorption was found to follow a pseudo-second order model which is based on the assumption that chemisorption is the rate determining step [38].
Garcia-Fayos et al. [27] reported that the adsorption of Cu2+ follows the pseudo-second order kinetic model with a coefficient of determination R2 = 0.999. The pseudo-second order kinetic model was also observed by Kalavathy and Miranda [26]. These authors obtained a (R2) ˃ 0.9995 and similar values for experimental and calculated adsorption capacities.
The pseudo-second order kinetic model is the most frequently used model in adsorption. It has been applied to the adsorption of several compounds. Contrary
![]()
Figure 6. Pseudo-first order (a), pseudo-second order (b), intraparticle diffusion (c) and Elovich (d) kinetic models for copper adsorption by GD powders.
![]()
![]()
Figure 7. Pseudo-first order (a), pseudo-second order (b), intraparticle diffusion (c) and Elovich (d) kinetic models for copper adsorption by GND powders.
![]()
Table 4. Kinetic data of copper adsorption by GD powders.
Pseudo-Second Order Model
Intraparticle Diffusion Model
Elovich Model
![]()
Table 5. Kinetic data of copper adsorption by GND powders.
Pseudo-Second Order Model
Intraparticle Diffusion Model
Elovich Model
to the pseudo-first order model, it is valid for the whole duration of the adsorption phenomenon and assumes a chemisorption mechanism [39].
3.5. Application of GD and GND Powders to Surface Water Samples
Table 6 shows the results of the characterisation of the surface water samples. The optimal conditions previously determined on the water samples spiked in the laboratory with the standard copper solution at 1000 mg∙L−1 were applied for the removal of Cu2+ from real surface water samples.
Figure 8 shows the variation between the initial (Ci) and equilibrium (Ce) copper concentrations obtained before and after addition of GD and GND powders to the water samples at the optimum analytical conditions. Initial copper concentrations ranged from 7.03 to 10.63 mg∙L−1 and are well above the concentration of 0.05 mg∙L−1 recommended by the Belgian Royal Decree of 4 November 1987. This decree sets basic quality standards for water in the public water system (surface water) in Belgium [40]. Also the concentration of copper recommended in drinking water by the WHO [7] is 2 mg∙L−1. These high copper concentrations in raw water samples could be explained by the water points located in urban areas and subject to anthropogenic activities, such as mining or agricultural activity, metal production, phosphate fertiliser production and factory effluents [41] [42]. Furthermore, as the samples were taken during a dry period (February 2020), the increase in Cu2+ concentrations could be mainly due to high evaporation during the dry period, as reported by Podgorski et al. [43] and Li and Zhang [44].
The different copper adsorption rates for GD and GND powders were calculated and their variation with the initial copper concentration in the water samples
![]()
Table 6. Surface water characterization.
AY: Ayamé; AB: Aboisso; PB: Port-Boüet; B: Banco. *Normal values according to Couture (2003); **Normal values according to Hade (2002).
![]()
Figure 8. Variation between initial and equilibrium copper concentrations in water samples.
![]()
Figure 9. Variation of copper adsorption rate with initial concentration in water samples.
is shown in Figure 9.
Copper adsorption rates ranged from 46.9% to 51.3% and from 27.9% to 61.9% for the GD and GND adsorbents, respectively.
For the same initial copper concentrations obtained in the four water samples, the GND adsorbent gave better results. Indeed, the adsorption rates of GND were higher than 50% except for sample PB, where the lowest adsorption rate of 27.9% was obtained. However, for sample B, which is also freshwater and comes from the same source as PB (Ebrié Lagoon), the adsorption rate was high (60.9%). This large difference in the copper adsorption rate in these water samples could be related to the salinity of these samples. Indeed, the salinity of freshwater is low (˂1 g∙L−1) but the salinity of the PB sample was 15.81 g∙L−1, making PB a salty water (>10 g∙L−1). Due to its location at Port-Boüet, the Ébrié lagoon is located near the sea, hence its high salinity.
For the GD adsorbent, the adsorption rates varied from 46% to 51%. The rate of 51.3% was obtained in sample AB (river “BIA”). This river is located in the middle of an urban area and would not be subject to much industrial activity.
The highest adsorption rate was 61.9% and was obtained with the GND adsorbent at the lowest copper concentration of 7.03 mg∙L−1. This could be explained by the fact that GND has a greater number of copper binding sites, but also by the contribution of the shells covering the kernels, which would have sites capable of binding TMEs.
The observation that is generally made by several authors is that the lower the initial concentration of metal, the greater the removal of this metal. Farrokhzadeh et al. [30] worked on the removal of copper by M. oleifera seed powders in aqueous solution. They reported that for initial TME concentrations of 50, 100 and 200 mg∙L−1, the percentage of adsorption was higher (35%) at the 50 mg∙L−1 concentration. Garcia-Fayos et al. [27] observed in their study on copper removal by Moringaoleifera seed hulls, that for initial copper concentrations ranging from 1 to 40 mg∙L−1, the maximum value of copper removal percentage was 78.6% at the 1 mg∙L−1 concentration. However, Kalavathy and Miranda [26] reported in their study on the adsorption of Cu2+ in the aqueous phase by activated charcoal from M. oleifera wood, that for initial concentrations ranging from 10 to 50 mg∙L−1, the amount of metal adsorbed per unit weight of the adsorbent increased with the initial concentration of metal ions; the maximum adsorption capacity being 10.1 mg∙g−1.
4. Conclusions
In this work, powders from dehulled (GD powder) and unhulled (GND powder) M. oleifera seeds were studied in order to demonstrate their adsorption capacity towards metal ions. The optimal adsorption conditions per batch (contact time, adsorbent mass, pH and temperature) were studied. These conditions were respectively for GD and GND: contact time = 20 and 50 min; adsorbent mass = 4.5 g; pH = 8; temperature = 20˚C. The pH appeared to be the most important parameter of this adsorption process with a maximum adsorption rate of 80% and 77.41% respectively for GD and GND powders.
The Langmuir isotherm model was the best applicable model to fit the experimental data of copper adsorption by Moringa powders. The adsorption process was spontaneous, endothermic with an increase in the disordered character of the system. The kinetics followed a pseudo-second order model suggesting a chemisorption mechanism.
The application of Moringa powders in surface water samples showed an adsorption rate between 28% and 62% for GD and between 47% and 51% for GND respectively. Furthermore, the shell covering the Moringa kernels could play a positive role in favour of the adsorption process as the GND powder presented the highest adsorption rate (61.9%).
The method used was simple, easily applicable and environmentally friendly (no other chemicals were involved). Moringa seed powders would therefore constitute an effective adsorbent material for the removal of certain metal ions. This method could be extended to other TMEs.