Tri-Power Analysis: The Advanced Post Hoc Triostatistical Assurance Model That Consists of Multiple Advanced Triostatistics to Further Verify, Validate, and Make Viable Ideally Replicated Results of Innovative Investigative Inquiry ()
1. Introduction
Tri-Power Analysis (also known as “The Trichotomous-Power Analysis” or “The Tri-Power Test”, i.e., “The Trichotomous-Power Analytic”) is also referred to be the representative nomenclature: “Tri- ”, (where z = v [x, y]) which uses the “Upright Right Triangle of Power” (to indicate “power” in terms of Cartesian coordinate exponentiation and conversely characterize the dynamics of triostatistical trichotomous triangulation). Tri-Power Analysis uses five triostatistics in a systemic sequential series of interdependent multivariate series of in-depth mathematical equations to verify, validate, and make viable the outcomes of future Tri-Squared Tests to “foretrending”. “Foretrending” as defined by the author of this narrative is a novel triostatistical terminology that is specifically defined as “a trichotomous data-driven phenomenon that is verified via validated triostatistical research inquiry that has assurance by virtue of sequentially established common traits that are certain, occur, and are guaranteed due to recorded series of observed facts; occurrences; or circumstances of an innovatively precise and meticulously determined research inquiry”. As such, Tri-Power Analysis seeks to “foretrend” the outcomes of a research investigation that is ideally replicated under the same conditions. This is a novel method of “Trichotomous Extrapolative Data Analysis” (an original terminology for a triostatistical method that infers or estimates by extending or projecting known information from statistically significant Tri-Squared Test). Thus, as an advanced post hoc triostatistics measure Tri-Power Analysis has “Three Distinct Primary Parameters” as “Trifold Trichotomous Units of Measure” as the “Units of Analysis”, they are: 1) Trichotomous Hindsight; 2) Trichotomous Insight; and 3) Trichotomous Foresight inspired by Fritz Scheuren’s (2020) presentation entitled “Foresight, Insight, Hindsight - United States Statistical Observations”. Tri-Power Analysis is a rigorously complex, meticulous, and detailed analysis methodology that uniquely combines four of the most powerful and essential Triostatistics: 1) The initial statistically significant Trichotomous Confirmatory Data Analysis (or Tri-CDA) Tri-Squared Test as the “Hindsight” “Unit of Analysis”; 2) The innovative TRIASIM [Trichotomous Analysis of Similarity] “Insight” “Unit of Analysis”; and lastly 3) The novel TRIROC [Trichotomous Rate of Change] “Foresight” “Unit of Analysis”. The fourth triostatistic is the validation metric TPA [“Trichotomous Progression Analysis”] that is used within the Tri-Power Analysis sequential series of equations to meet the specifics of the distinctive Tri-Power Analysis Units of Analysis. The fifth Triostatistic is the universally applicable TRILOG procedure that creates the validation equations for Trichotomous Foresight Analysis and also is the building block for all Triostatistics as it uniquely creates the mathematical equations for foundation of the Standard 3 by 3 Tri-Squared Test Tableand the core components for more advanced Triostatistics. Together the four advanced post hoc triostatistics build the trichotomous primary parameters [of Trichotomous: Hindsight; Insight; and Foresight] that are used to determine the final viability, validity, and verifiability of a trichotomous inquiry, intervention, or solution based on its initially triostatistically determined efficacy [or “effectiveness”], essentiality [as “condition(s)”], and exactness [as “functionality”]. Essentially, the Tri-Power Analysis advanced post hoc measurement methodology is a highly advanced “Trichotomous Assurance Model” used to determine the research variability, viability, and validity of an initial statistically significant Tri-Squared Test that is ideally replicated under the same conditions in a similar environment (taking into account the initial data-driven research results of the triostatistically significant TCV [“Trichotomous Categorical Variables”] and TOV [“Trichotomous Outcome Variables”] of the identified Tri-Squared Test). In terms of its working trichotomous analysis procedures, as a whole Tri-Power Analysis follows research parameters similar to ordinal logit analysis. The orderly presentation of similarities in terms of “Trichotomous Insights” are in deference to more traditional triostatistical methods and procedures designed to deliver an ideal assurance model in terms of likelihood based on calculated percentages determined from initial research inferences that are drawn from the initially statistically significant Tri-Squared Test. The initial Tri-Squared Test results represent a definitive form of “Trichotomous Hindsight” “an in-depth captured look at the past to directly inform the future” and they must then be ranked in an ordinal fashion according to Trichotomous Outcome Variable [“TOV”] results. This is the beginning of TRIASIM or [“Trichotomous Analysis of Similarity”] as the “Trichotomous Insight” metric. The ordinal ranking into novel trichotomous power outcomes provides in-depth data on trends and similarities within the data currently that will allow the later building of a greater platform using Geometric TPA or [“G-TPA” = “Geometric Trichotomous Progression Analysis”] to determine “Trichotomous Foresight” as a “Foretrend Analysis” metric via TRIROC or [“Trichotomous Rate of Change”]. In this manner, very specific, precise, meticulous, and sequential calculations to determine the final research assurance outcomes (referred to as “The Final True Tri-Power Analysis Outcome”) as the likelihood of their occurrence in Tri-Power percentages. In the next section the models the advanced post hoc triostatistics involved in Tri-Power Analysis are presented in Figures 1-5:
![]()
Figure 1. The complete Tri-Power analysis model.
![]()
Figure 2. The cyclical definitive Tri-Power analysis model.
![]()
Figure 3. The Tri-Power analysis sequential model.
![]()
Figure 4. The triostatistics Tri-Power analysis primary parameters model.
![]()
Figure 5. The triostatistics Tri-Power analysis primary parameters linear model.
Figure 1 Summary: Figure 1 above exhibits the essential elements of the Triostatistical Tri-Power Analysis methodology in a cyclical model. Trichotomous Hindsight is first via the initial statistically significant Tri-Squared Analysis immediately followed by Trichotomous Insight via the TRIASIM Triostatistic into Trichotomous Foresight through TRIROC with the Final result of Tri-Power Analysis linked to all areas in the center of the model. Figure 2 follows and details the same model definitively.
Figure 2 Summary: Figure 2 above details and defines the areas displayed in Figure 1 for the Tri-Power Analysis Triostatistic. Particularly defined are the three main Triostatistics: TRIASIM; TRIROC; and Tri-Power Analysis. Figure 3 follows and shows the sequential steps of Tri-Power Analysis.
Figure 3 Summary: Figure 3 illustrates the sequential steps in a series of Tri-Power Analysis. The steps are: 1) Trichotomous Hindsight; 2) Trichotomous Insight which is computed via (2a) TRIASIM; 3) Trichotomous Foresight which is computed via (3a) TRIROC; and lastly 4) The Core or Nucleus which is the final Tri-Power Analysis Outcome. Figure 4 follows and reduces the original model into the Tri-Power Analysis 3 Primary Parameters.
Figure 4 Summary: Figure 4 displays a simplified cyclical model that has the 3 Primary Parameters of Tri-Power Analysis which are Trichotomous: Hindsight; Insight; and Foresight. Figure 5 which is the last figure follows and presents a rectilinear model of the 3 main Triostatistics.
Figure 5 Summary: Figure 5 above presents a simplified linear model of the 3 primary Tri-Power Analysis Triostatistics which are: TRIASIM; TRIROC; and the final Tri-Power Analysis Outcome. In the sections that follow the trichotomy as a terminology is defined; the field of Triostatistics is explained with all measures that fall under it are clearly defined and presented for current and future reference.
2. The Term “Trichotomy” Defined
The term “Trichotomy”: is pronounced [“trahy-kot-uh-mee”], spelled “tri·chot·o·my”, and is a noun with the plural written form “tri·chot·o·mies”. “Trichotomy” has the following threefold definition: 1) Separation or division into three distinct parts, kinds, groups, units, etc.; 2) Subdivision or classification of some whole into equal sections of three or “trifold segmentation”; and 3) Categorization or division into three mutually exclusive, opposed, or contradictory groups, for example, “A trichotomy between thought, emotions, and action (Osler, 2012a).” A “Trichotomy” in terms of philosophy can be referred to as a threefold method of classification. Philosopher Immanuel Kant (in his “Critique of Pure Reason”) adapted the Thomistic acts of intellect in his trichotomy of higher cognition—a) understanding, b) judgment, c) reason—which he correlated with his adaptation in the soul’s capacities—a) cognitive faculties, b) feeling of pleasure or displeasure, and c) faculty of desire (Kant, 2007). In terms of mathematics, Apostol in his book on calculus defined “The Law of Trichotomy” as: Every real number is negative, 0, or positive. The law is sometimes stated as “For arbitrary real numbers a and b, exactly one of the relations a < b, a = b, and a > b holds” (Apostol, 1967).
3. The Science, Field, and Study of Triostatistics
Triostatistics (or more simply “Triostat”) is the science, field, and study of the application, scale, and measurement of the mathematical “Law of Trichotomy” to research design(s) for in-depth investigative inquiry. It also includes the advanced statistical application of Post Hoc measures to the outcomes of an initial “Confirmatory Data Analysis” Trichotomous Squared Test. As a statistical discipline Triostat concerns the development and application of specific and uniquely designed advanced Post Hoc statistical tests, methodologies, and techniques. Triostat is used to further investigate the research outcomes from initially statistically significant Tri-Squared Tests. Research studies that analyze data through the use of the Trichotomous Squared Test are the foundation for Triostatistics. Thus, Triostatistics is the further investigation and precise in-depth study of the dynamic data that is the statistically significant Tri-Squared Test results (Osler, 2014). The word “Triostatistics” is a portmanteau of the terms: “Trichotomous” and “Statistics”; that can also be referred to as “Triostat”, “Advanced Trichotometrics” or “The Science of Trichotomy”. More definitively Triostatistics is a branch of the science statistics that is the specific application of statistical methods, techniques, and strategies to a wide range of topics that concerns the Tri-Squared Test. At the heart of this statistical discipline is the application of the mathematical “Law of Trichotomy”. The science of Triostatistics encompasses the design of Tri-Squared experiments, especially in education and social behavioral settings. However, the utility and flexibility of Triostat as a body statistical metrics allows it to be applied to a variety of sciences (through the use and application of the mathematical “Law of Trichotomy”). Triostatistics as a discipline is the collection, summarization, and analysis of data from Tri-Squared experiments; and the interpretation of, and inference from, statistically significant Tri-Squared Test results (Osler, 2014).
4. The Current List Triostatistical Measures and Metrics
The following Tableis an exhaustive list of currently published Triostatistical measures in use in investigative inquiry (noting that the vast majority of these tests and metrics can be used beyond Triostatistical research inquiry, however, a few are descriptively highlighted in the list below due to their specific use with extraneous research methods that extend their use beyond the stringencies of trichotomy):
![]()
![]()
Table 1. A current exhaustive list of triostatistics research methodologies, measures, and tests (Osler, 2018).
Table1 Summary: Table1 above details and updates Triostatistics by naming its related measures (currently there 38 different Triostatistical measures) in an organized labelling methodology that can be easily accessed and rapidly referred to as an easy-to-read rapid Triostatistics Reference Table. Table2 follows and more specifically provides detailed definitions of all of the metrics and measures (with four new additions) that are identified and listed in Tablein exactly the same order including 5 new metrics at the bottom of Table1 & Table2 (thereby expanding upon the previous list that was presented in the Osler, 2018 publication entitled, “Process Education: Learning to Learn” via an Explicative Encyclopedia of Innovative Triostatistical Methods, Models, Metrics, and Statistical Procedures. July-September i-manager’s Journal of Educational Technology).
5. Identifying Triostat Inquiry Viability and Research Applicability via a Comprehensive and Detailed Tabular Triostatistics Encyclopedia of Metrics and Measures
Table 2 Summary: Table 2 above details the current list of Triostatistics from an identity and usability format that specifically provides detailed definitions of all of the metrics and measures that are associated with primary, secondary, and post hoc trichotomous research, measurement, and analytics (as last detailed in Osler, 2018 and currently updated in this narrative). The next section explains how to use Tri-Power Analysis as a data analysis methodology by parsimoniously detailing each of the Primary Parameters (as Trichotomous: Hindsight; Insight; and Foresight) in a series of sequential equations that are explained in detail using authentic trichotomously statistically significant data to illustrate exactly how Tri-Power Analysis is used as an advanced post hoc trichotomous analytical methodology.
6. Tri-Power Analysis: Detailed Data Analysis Methodology
Tri-Power Analysis as a whole is best explained in the following Tableof Tri-Power Analysis Definitive Tableof Primary Parameters.
![]()
Table 3. The Tri-Power analysis definitive table of primary parameters.
Table3 Summary: Table3 above details the current list of Tri-Power Analysis Triostatistics used to perform the necessary calculations needed to determine the specifics of Trichotomous Hindsight; Insight; and Foresight. By following Table3 one begins to understand how Tri-Power Analysis as a whole works. This Basic Tablecovers the primary calculations used in TRIASIM which in ordinal ranking and some calculations is very much similar to “Ordered Logit Models” (Williams, 2019) and TRIROC which creates a “Trichotomous Rate of Change Equation” within the confines and parameters of the Tri-Squared Test based upon the “Rate of Change” equation used in business as the “Rate of Change (ROC)” (Chen, 2019). In the next section Tri-Power Analysis Trichotomous Hindsight is explore immediately followed by the remaining two Tri-Power Analysis Primary Parameters.
7. Tri-Power Analysis: Trichotomous Hindsight
Tri-Power Analysis begins with a data “Trichotomous Hindsight” note the outcomes of the statistically significant Tri-Squared Test below which will used to conduct a Tri-Power Analysis on in terms of TOVs or “Trichotomous Outcome Variables”.
The Initial Outcomes of the Statistically Significant Tri-Squared Test as an Example of Tri-Power Analysis: “Trichotomous Hindsight”
The Tri-Square Test Formula for the Transformation of Trichotomous Qualitative Outcomes into Trichotomous Quantitative Outcomes to Determine the Validity of the Research Hypothesis:
TableOne illustrates the qualitative mathematical application of the Trichotomous-Squared (“Trichotomy-Squared”, “Tri-Squared” or “Tri-Square”) statistical analysis procedure. The results are: Tri2 Critical Value Table= 8.131 (with d.f. = 4 at α = 0.975). For d.f. = 4, the Critical Value for p > 0.975 is 0.484. The calculated Tri-Square value is 8.131, thus, the null hypothesis (H0) is rejected by virtue of the hypothesis test which yields the following: Tri-Squared Critical Value of 0.484 < 8.131 the Calculated Tri-Squared Value. The TableOne 3 × 3 Tablereports the qualitative outcomes based on the Inventive Investigative Instrument Trichotomous Categorical Variables according to participant responses as the Trichotomous Outcome Variables. TableOne shows that participants primarily and overwhelmingly selected the “Yes” Categorical Variable (a1b1 = 48, a2b1 = 43, and a3b1 = 38) rather than the alternative Categorical Variables of either “No” or “Unknown” (the “Unknown” C. V. indicated unselected or inapplicable responses to an item). The mathematical formula for the Tri-Squared is reported illustrating the final outcome of the research hypothesis test: the null hypothesis (H0) is rejected at p > 0.975 is 0.484. TableTwo follows and provides the outputted quantitative outcomes of the Tri-Squared Test (Osler, 2012a; Osler &Waden, 2012b).
8. Tri-Power Analysis: Trichotomous Insight
To accurately and fully implement the power of the Tri-Power Analysis in terms of “Trichotomous Insight” reflect on the following initial research investigation research hypotheses:
The Initial Tri-Squared Test Research Hypotheses for Trichotomous Confirmatory Data Analysis
H0: There is no significant difference on the Pre-Test, Mid-Test, and Post-Test outcomes of the Tri-Squared Test for each of the identified Trichotomous Categorical and Outcome Variables [on the Standard 3 × 3 Tri-Squared Table] as responses to the three Inventive Investigative Instruments delivered during different times to the research participants [nTri = 17] conducted during the designated time period of the research investigation [Note: In this particular example, the researcher is delivering the same Triple-I tool three different times—in other investigations the instrumentation may be subject to change depending upon research needs and circumstances].
H1: There is a significant difference on the Pre-Test, Mid-Test, and Post-Test outcomes of the Tri-Squared Test for each of the identified Trichotomous Categorical and Outcome Variables [on the Standard 3 × 3 Tri-Squared Table] as responses to the three Inventive Investigative Instruments delivered during different times to the research participants [nTri = 17] conducted during the designated time period of the research investigation.
The [H1] was supported as illustrated below in the associated mathematical hypotheses that directly align to the aforementioned research hypotheses that were written in the following format:
Results of the Tri-Squared Test Research Mathematical Hypotheses
H1: Tri2 ≠ 0
Therefore, the associated research hypotheses (to the aforementioned mathematical hypotheses) results of the Trichotomous Confirmatory Data Analysis is written and affirmed as follows:
[Accepted] H1: There is a significant difference on the Pre-Test, Mid-Test, and Post-Test outcomes of the Tri-Squared Test for each of the identified Trichotomous Categorical and Outcome Variables [on the Standard 3 × 3 Tri-Squared Table] as responses to the three Inventive Investigative Instruments delivered during different times to the research participants [nTri = 17] conducted during the designated time period of the research investigation.
Conducting the Tri-Power Analysis Trichotomous Insight Calculations
Grand Total [GTTri] = 153.
The selected “Unit of Analysis” is the initial Tri-Squared Test TOVs which are respectively = [b1; b2; and b3]. The Trichotomous Logic [or “Trilogic”] for Trichotomous Insight (according to scoring rank by amount) is:
b1 = base; b3 = not b1 and not b2; and b2 = -b1.
The Trichotomous Insight Trend Analysis is identified as follows using TRIASIM calculations:
The Tableabove is provided to explain in detail data calculations. Typically, it would not appear in a final report on Tri-Power Analysis Trichotomous Insight Outcomes (unless used for purely explicative reasons). Instead, the Tablebelow which provides TRIASIM within Data calculations would be presented in the final Tri-Power Analysis report. In the Tableabove, the ceiling and floor functions of the High, Medium, and Low Outcomes must yield 100%. Thus, [High + Medium + Low] =1.00 = 100%. Note: the combined floor and ceiling functions allow for precise rounding of the last decimal integer to maximize the spacing in the cells above (in the second to last row of percentage data) allocating for multiple digits in the final cumulative percentages. The same functions apply to the “Insight Proportion” of the TRIASIM Tablethat follows below.
TRIASIM Tablefor Within Trichotomous Data for Insight on Tri2 Regarding Outcomes
9. Trichotomous Foresight: Establishing the Trichotomous Logit Model
The Trichotomous Logit Model is based upon the research calculations by the author related to the publications on Visualus © (Osler, 2010) Isometric Cuboid and the Tri-Squared Test (Osler, 2012a) distribution and in-depth research calculations related to the two. In addition, as the research related the aforementioned to the Pythagorean Theorem new mathematical models developed. A further in-depth exploration was conducted on the permutations of the Standard 3 by 3 Tri-Squared TableFormat and a literature view on geometric calculations shed light on relationship between the noted mathematical constants “phi” (the golden ratio), “e” (the natural logarithm), and “pi” (the ratio between the circumference of a circle and its diameter). The author was inspired via reflection on three particular research publications/narratives: “Rescaling the Pythagorean Theorem” (Azad, 2019); “Pi (π), Transcendental, Natural Log Base (e) Function” (Stefanides, 1989); and “The Pythagorean Relationship between Pi, Phi and e” (Felicetti, 2017). The results of the abovementioned research led the author to trichotomously create, integrate, and further develop the “3-4-5-6 Golden Upright Right Triangle” (or “GURT”) as a trichotomous trioengineering research model for the base calculations that are presented in the next section.
The 3-4-5-6 Golden Upright Right Triangle Model
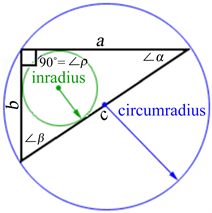
The author created and identified “3-4-5-6 Golden Upright Right Triangle” (or “GURT”) measurements of are as follows:
Side a (top side) = 4;
Side b (far left side) = 3;
Side c (diagonal side = G-TPA Progression Line also the hypotenuse) = 5;
G-TPA Inclination = 0.75
Total ∆abc = 0.5 (or 1/2 of the Standard 3 by 3 Tri-Squared Test Tableand the Front of the Visualus © Isometric Cuboid);
Total ∆abc in deference to [“∇ ”] = ∇abc = 1;
;
;
;
h = 2.4;
The “Ideal Triangular Side Mean” or
Area = 6 (representing the “6” in the 3-4-5-6 GURT Model);
Perimeter = 12;
Inradius = 1;
Circumradius = 2.5;
Parallel Side Differential = 2;
Inscribed Insquare Side = 1.714285714285714…;
Inscribed Insquare Area = 2.938775510204082…; and
Inscribed Insquare Perimeter = 6.857142857142857…
Using the “Golden Upright Right Triangle” pi (π, the difference between a circle’s circumference and its diameter), phi (ϕ, the golden ratio), and e (the natural logarithm) are all related. Due to the use of the “Golden Upright Right Triangle” to relationally define the three aforementioned mathematical constants are each now redefined using the “Golden Upright Right Triangle” (as “![]() ” where, “
” where, “![]() ” =“
” =“![]() ”= “Tri-
”= “Tri-![]() ”) in as the “Geometrically Measured TPA Trine Symbol” or (“[∇]”). Thus, traditional “pi” now becomes π[∇] = “The Ideal Triangular Pi”; traditional “phi” now becomes ϕ[∇] = “The Ideal Triangular Phi”; and traditional “e” now becomes e[∇] = “The Ideal Triangular Natural Logarithm” (all similar to the “Ideal Triangular Side Mean” or “
” = 4). The calculations for each of the respective ideals are as follows:
”) in as the “Geometrically Measured TPA Trine Symbol” or (“[∇]”). Thus, traditional “pi” now becomes π[∇] = “The Ideal Triangular Pi”; traditional “phi” now becomes ϕ[∇] = “The Ideal Triangular Phi”; and traditional “e” now becomes e[∇] = “The Ideal Triangular Natural Logarithm” (all similar to the “Ideal Triangular Side Mean” or “
” = 4). The calculations for each of the respective ideals are as follows:
1) “The Ideal Triangular Pi” =
(which is very close to the traditional numerical value of “pi”) @ 3.141592654…;
2) “The Ideal Triangular Phi” =
(which is exactly identical to the traditional numerical value of “phi”) ≡ 1.618033988749895…; and
3) “The Ideal Triangular Natural Logarithm” = e[∇] = [Inscribed Insquare Side (s) + ∇abc] = 2.714285714285714285… (which is very close to the traditional numerical value of “e”) @ 2.718281828459045…
The new mathematical constant for the “Ideal Triangular Natural Logarithm” = e[∇] (which is also identified as the “Perfect Natural Logarithm” due to the repetitive sequence of its remaining digits) becomes critically important in the establishment of the Trichotomous Logit Model or “TRILOG”.
Calculating TRIASIM via the Trichotomous Logit Model or “TRILOG”
Based on the Data Provided the Within Tri-Squared Test TOV (“Trichotomous Outcome Variable”) Percentage of Insight Accuracy Using the TRIASIM Trichotomous Logit Model (or “TRILOG”) to “Foretrend” [“∇ ”] is as follows:
,
where, e[∇] = “The Perfect Trichotomous Natural Logarithm” = 2.714285714285714285…; and “∇ ” = The italicized nabla representing the “Golden Upright Right Triangle” (i.e., “GURT”) as the “Foretrend” Symbol for TRIASIM (and TRIROC that follows after the TRIASIM calculations) for TOV b1; b2; and b3 respectively is the TRILOG Model or
.
, Creates the G-TPA (Geometric Trichotomous Progression Analysis) Model for TOV around
(the precise amount of “G-TPA Inclination”) as the inclination of the G-TPA line for the Standard 3 by 3 Tableof the Tri-Squared Test. Thus,
, for
;
; and
these provide:
for
(indicating that based on ordinal ranking a 54% current similarity exists by respondents in terms their responses to items related to TOV: b1);
for
(indicating that based on ordinal ranking a 92% current similarity exists by respondents in terms their responses to items related to TOV: b3);
for
(indicating that based on ordinal ranking a 93% current similarity exists by respondents in terms their responses to items related to TOV: b2); and
(Currently Indicating a Final Insight Ratio of 1.472 to 1);
(Currently Indicating a Final Insight Ratio of 2.501 to 1); and
(Currently Indicating a Final Insight Ratio of 2.532 to 1).
The final calculations above indicate the Trichotomous Cumulative Odds ratio by TOV using “Foretrending” as the “Frequency Expected Percentage” times the Perfect Trichotomous Natural Logarithm as the model to produce a “Cumulative Likelihood Ratio for each TOV” by Tri-Squared Test Row that would occur in the future under the same conditions. A Tablefollows that explains the Trichotomous Logit Model “TRIASIM” calculations in detail.
The TRIASIM (Trichotomous Logit Model) Calculations
10. Trichotomous Foresight: Trichotomous Rate of Change or “TRIROC”
Trichotomous Foresight calculations verify the outcomes of “True Tri-Power Analysis” through TRIASIM (“Trichotomous Analysis of Similarity”) and shed light on and provide new information on future replications of the initial research that would occur under the same or similar conditions. This thereby verifies and validates the aforementioned as an assumptive presupposition based upon “Trichotomous Rate of Change” or “TRIROC” that prides a model of the percentage of future outcomes level of success with replication of the initial Tri-Squared Study (again under the same or similar conditions). As such the Trichotomous Foresight calculations are as follows:
;
; and
.
The above calculated values as percentages indicate the following: There is a 99.579% likelihood that the [b1] Trichotomous Outcome Variable results for in the initial research study will accurately replicated in the future under the same or similar conditions; There is a 92.910% likelihood that the [b3] Trichotomous Outcome Variable results for in the initial research study will accurately replicated in the future under the same or similar conditions; and lastly There is a 91.518% likelihood that the [b2] Trichotomous Outcome Variable results for in the initial research study will accurately replicated in the future under the same or similar conditions.
11. The Final True Tri-Power Analysis Results
The final results of the Tri-Power Analysis on the data yielded the final following results in the Tri-Power Analysis TRIROC Table:
The True Tri-Power Analysis TRIROC Tablefor Final Foresight and Forecast of Data Outcomes that both Validate and Verify the Subsequent Accuracy of a Research Investigation Conducted Under the Same Conditions
True Tri-Power Analysis TRIROC TableSummary: There is overwhelming evidence as an overall [94.669%] likelihood that the [b1; b3; and b2 (as presented in Trichotomous Ordinal Logit)] Trichotomous Outcome Variables results for in the initial research study will accurately replicated in the future under the same or similar conditions, because the Final Tri-Power Analysis yielded the final occurrence outcome of: [Tri-![]() = 94.669%].
= 94.669%].
12. Discussion
The trichotomous research viability, ergonomic validity, and precise verifiability of the Tri-Power Analysis Test make it a great statistical tool that greatly enhances the utility and overall usability of the Tri-Squared Test. It expands the Tri2Test through Trichotomous Hindsight; Foresight; and Insight in the following manner: 1) Trichotomous Hindsight—the explicit measurement of a statistically significant Tri-Squared Test to gain an initial understanding of research conditions after it has occurred; 2) Trichotomous Insight—the explicit measurement of a statistically significant Tri-Squared Test to gain a greater understanding of initial research under present conditions as it occurred; and lastly 3) Trichotomous Foresight—the explicit measurement of a statistically significant Tri-Squared Test to gain a more in-depth understanding of the research if idealistically repeated or replicated under same conditions before it occurs. As a result, the data from a Tri-Power Analysis provides, “a plausible statistical measure that allows investigators to interpret the in-depth and rich complexities of Tri-Squared research data” (Osler, 2014). Thus, the Tri-Power Analysis methodology greatly extends the general conventions of traditional trichotomous statistics by active enhancing and extending the previous limits of Triostatistics into new vistas. It also, “removes any possible biases that may occur by applying purely subjective observations that do not rely on purely quantifiable data to determine differences in research outcomes” (Osler, 2014) by critically examining the data for current trends and future viability.
13. Recommendations
The data used for the Tri-Power Analysis from a past study presented several statistically significant internal findings that effectively and efficiently illustrated the benefits of the Tri-Power Analysis. The author makes the following recommendations for the use of Tri-Power Analytics in the future:
1) The overall utility of the analysis procedure will be increased with more widespread use by the research community;
2) Replication of past statistically significant Trichotomous-Squared Test research would greatly benefit from the additional post hoc study and use of Tri-Power Analysis; and
3) Follow-up studies should be conducted to determine the efficacy of the entire methodology.
14. Conclusion
The purpose of this narrative was to chronicle the applicability, provide an epistemological rationale for, and illustrate the usability of the Tri-Power Analysis (as an advanced post hoc Triostatistical Test methodology). As illustrated in the initial statistically significant Tri-Squared Test data, Tri-Power Analysis is a meticulously valid way of determining the Hindsight, Insight, and Foresight of multiple iterations of the replicable implementation of an initial trichotomous research investigation. This new methodology (though very stringent) is ideal for further post hoc analysis of triostatistics research investigations. The Tri-Power Analytical procedure yields a new triostatistical viewpoint that advances the field of statistics from a detailed in-depth analysis methodology that examines a research investigation from multiple angles to observe and comprehensively determine the efficacy, essentiality, and exactness of an already examined trichotomous inquiry, intervention, and/or solution. Thus, Tri-Power Analysis as a new addition to the field and science of Triostatistics thereby adds much greater breadth and depth to future trichotomous research investigations by examining data from a reflectively complex and advanced post hoc statistical analytical perspective. It also adds lasting value to the field of trichotomous research inquiry and research in general as a whole. As trichotomous-based research continues to be adopted and grow, Tri-Power Analysis will become indispensable tool and add greater value to innovative and entrepreneurial research methods in a variety of disciplines, fields, and sciences that select Triostatistics as a preferred research analysis methodology.