The Effects of Parametric, Non-Parametric Tests and Processes in Inferential Statistics for Business Decision Making
—A Case of 7 Selected Small Business Enterprises in Uganda ()
1. The Research Structure
1.1. Introduction and Background
This article gives a critique of parametric and nonparametric tests and processes of inferential statistics in forecasting and flows in 7 selected small business enterprises in Uganda. Forecasting is one of the decision making tools in a business enterprise. This may include forecasting customer flows, volumes of sales and many others.
Business forecasting is an act of predicting the future economic conditions on the basis of past and present information. It refers to the technique of taking a prospective view of things likely to shape the turn of things in foreseeable future. As future is always uncertain, there is a need of organized system of forecasting in a business (Dhaval, 2010).
(Smith & Finger, 2014) define Business Process Management (BPM) as “a synthesis of process representation and collaboration technologies that remove the obstacles blocking the execution of management intentions. Therefore, BPM is the convergence of management theory … with modern technologies.” The portion of this definition that is often overlooked in the rush toward technology is the discernment of “management intentions,” or decision-making.
Decision making is a vital component of big and small businesses successes. In the long run, what drives business success is the quality of decisions and their implementation. Decisions based on a foundation of knowledge and sound reasoning can lead the company into long-term prosperity; conversely, decisions made on the basis of flawed logic, emotionalism, or incomplete information can quickly put a business out of commission (Barinly, 2018).
Statistics is a branch of mathematics concerned with the collection, classification, analysis and interpretation of facts, for drawing inferences on the basis of their quantifiable likelihood, probability (Finance, 2018).
Collaborative networks are becoming more important in global and regional business, thanks to their ability to combine organizational competences. But as individual companies seek efficiency gains by focusing on their core competences while outsourcing non-core operations, the degree of inter-firm transactions grows considerably (Ghiţă, 2008: pp. 242-245).
The use of statistical techniques in business decision making has created concern for many years. Statisticians have long expressed concern about the slow adoption of statistical ideas by researchers and the frequent misuse of statistics when statistical methods were used (Garfield, 2008).
There are basically two types of statistics which include descriptive and inferential statistics. Descriptive statistics enable the researcher to summarize and organize data in an effective and describes the varibales under the study. It involves the use of tables, charts, graphs, mean, modes, median, standard scores and correlation to treat collected data (Kowalczyk, 2018).
Inferential statistics are mathematical methods that employ probability theory for deducing (inferring) the properties of a population from the analysis of the properties of a data sample drawn from it.
A parametric test is used when information about the population is completely known by with help of its parameters. For example, t-test, z-test, ANOVA, however, if there is no knowledge about the population or parameters, but still it is required to test the hypothesis of the population, we use a non parametric test. For example, Mann-Whitney, rank sum test, Kruskai-wallis (Prakash, 2013).
We sensitively note, that in evidence based decision making, especially in business investments and decisions, we need to use and refer to either parametric and/or non parametric statistics tests or processes.
Nonparametric tests are also called distribution-free tests because they don't assume that your data follow a specific distribution. You may have heard that you should use nonparametric tests when your data don’t meet the assumptions of the parametric test, especially the assumption about normally distributed data (Stone, 2015).
The more important a given decision is, the harder it becomes to select which way to go.Gathering data and seeking input can help. However it may also lead to analysis paralysis.
Customer flow is the number and pattern of customers coming into or passing through a store. There are a few ways a store can monitor its customer flow, including time lapse, closed-circuit television, observation, an analysis of purchase data and or even somewhat controversially through your Smartphone. Jan 21, 2014.
1.2. Statement of the Problems
The key problems facing the Small and Medium Enterprises (SMEs) which dominate the private sector of our economy, in terms of both output and especially of employment SMEs are those of survival and growth. Although comprehensive, up to date and reliable data are lacking, it is evident that only a minority of SMEs survive in operation for more than a few years and that very few achieve sustainable growth (Kasekende, 2018).
Every success, every mishap, every opportunity seized or missed by an organization (large or small) is the result of a decision that someone made or failed to make. The assumption of good decisions and their fast implementation determine essentially the performance of an organization (Roger & Blenko, 2006) cited by (Ogarcă, 2010).
Improving the forecasting process may enable managers to make better decisions (Siriram, 2016).
Most of such decisions are based on non-parametric processes or parametric process and calculations, yet the reverse would hold. Except when the right statistical techniques are used on a right data, the research result might not be valid and reliable and subsequently the decisions may be misleading. Therefore, there is need to analyse parametric and non-parametric tests and processes in business decision making.
1.3. Objectives of the Study
The following were the objectives of the study:
· To assess the levels and relevance of applications of parametric and non parametric tests and processes in business decision making especially forecasting and flows,
· To examine the implication of parametric and non parametric statistics on reliability of research results.
2. Literature Reviews
This section looks at what other scholars have said and presented about parametric and non parametric tests and processes in business decision making.
2.1. Theoretical Review
The study was guided by two theories: The Theory of Economic Rhythm and Cross-Cut Analysis:
2.1.1. There Has Been Several Reviews and Updates There after Theory of Economic Rhythm (University of Chicago, 1931): Reviewed and Referred to as Theory of Business Cycles (Bratt, 1931)
This theory propounds that the economic phenomena behave in a rhythmic manner and cycles of nearly the same intensity and duration tend to recur. According to this theory, the available historical data have to be analyzed into their components, i.e. trend, seasonal, cyclical and irregular variations. The secular trend obtained from the historical data is projected a number of years into the future on a graph or with the help of mathematical trend equations. If the phenomena are cyclical in behavior, the trend should be adjusted for cyclical movements.
2.1.2. Cross-Cut Analysis Theory (Das, 2009) with Several Reviews
In this method of business forecasting, the combined effect of various factors is not studied, but the effect of each factor, that has a bearing on the forecast, is studied independently. This theory is similar to the Analysis of Time Series under the statistical methods. Where it is stated that all businessmen have to make forecasting by analyzing the past to predict the future performances
2.1.3. Levels and Relevance of Applications of Parametric and Non Parametric Tests and Processes in Business Forecasting
A recent series of papers by Charles T. Perretti and collaborators have shown that nonparametric forecasting methods can outperform parametric methods in noisy nonlinear systems. Such a situation can arise because of two main reasons: the instability of parametric inference procedures in chaotic systems which can lead to biased parameter estimates, and the discrepancy between the real system dynamics and the modeled one, a problem that Perretti and collaborators call “the true model myth” (Jabot, 2015).
The first non-parametric procedure consists in examining the relevant time series to locate the peaks and troughs visually (graphical approach). Although not sufficient, this naive procedure can sometimes lead to fruitful results and can be seen as a primary filter (Anas & Ferrara, 2003).
However, On the other hand, it is important to remember that, it’s safe to say that most people who use statistics are more familiar with parametric analyses than nonparametric analysis. Nonparametric tests are also called distribution-free tests because they don’t assume that your data follow a specific distribution.
You may have heard that you should use nonparametric tests when your data don’t meet the assumptions of the parametric test, especially the assumption about normally distributed data. That sounds like a nice and straightforward way to choose, but there are additional considerations (Figure 1).
2.2. The Implication of Parametric and Non Parametric Statistics on Reliability of Results
Looking at Figure 1, Parametric and Non parametric statistics is in hierarchies when it comes to reliability of results of the studies conducted using either of the measures.
According (Kuzon Jr., Urbanchek, & McCabe, 1996b) Cited by (Felix, 2015) wrote on seven peccadilloes of using statistical analysis. These ‘peccadilloes’ we
![]() Source: Surbhi S (May 2, 2016), Difference between Parametric and Nonparametric Test.
Source: Surbhi S (May 2, 2016), Difference between Parametric and Nonparametric Test.
Figure 1. Layout of parametric and nonparametric hypothesis tests hierarchy.
can refer to them as errors, can make research result not to be valid and reliable thus influencing decision making especially when it comes to forecasting.
· The parametric analysis for ordinal data.
· The inappropriate use of parametric analysis in general.
· The failure to consider the possibility of committing type II statistical error.
· The use of unmodified t-tests for multiple comparisons.
· The failure to employ analysis of covariance, multivariate regression and nonlinear regression, and logistical regression when indicated.
· The habit of reporting standard error instead of standard deviation.
· The under use or over use of statistical consultation.
These errors do not only influence reliability of results but also aggressively influence and affect business decision making in real life context.
The basis of both errors 1 and 2 is disregarding specific conditions about the parameters of the population being studied. Sin 1 is the use of a parametric statistical test for ordinal data analysis. Expressing ordinal data using integers does not justify the use of parametric statistics. Instead scale data is necessary to be used.
However, on many occasions, several common parametric tests (the t-test in particular for example) are “tolerant” of relaxation of these two criteria, in strict terms; parametric analysis should only be employed if they can be fulfilled.
Considering error 3, when using the calculation of a probability to decide whether two means are “different” or “the same,” a widely accepted significance level of 0.05% or 5% is used. If we compute that the likelihood of two samples being drawn from a single population is less than 5%, we conclude that the two means are “statistically significantly different.”
The interpretation of this conclusion is clear. Our null hypothesis was that there is no difference between two means. Rejection of this null hypothesis signifies that there is less than a 5% chance that our conclusion (that the means are different) is erroneous. We accept a 5% chance of incorrectly rejecting the null hypothesis. This wrongful rejection of the null hypothesis when it is true is referred to as a type I error. Alpha (α) is the probability associated with committing a type I error. By preselecting a (usually 5%), rejection of the null hypothesis is associated with a known and controllable chance of error.
A further consideration arises when we accept the null hypothesis, concluding that we fail to find a real difference between the two sample means. A type II error occurs when the null hypothesis is false and we fail to reject it.
The probability of committing a type II error is termed beta. Alpha and beta are inversely related and vary inversely with sample size. To decrease the probability of committing both type I and type II errors, the sample size is increased. When comparing two sample means given a level and sample size (N), the estimated depends on the magnitude of the difference between the two means and sample variance
Considering peccadillo 4, this problem is again related to the calculation of probabilities and, specifically to type I error. In comparing three groups A, B, and C. in an experiment, we must perform three pair wise comparisons. A vs B, B vs C and A vs C. The cumulative probability of erroneously rejecting the null hypothesis is 5% (for A vs B) + 5% (for B vs C) + 5% (for A vs C) = 15% overall. As more groups are compared, this cumulative chance of type I error is compounded. Thus, multiple unmodified pair wise comparisons are not valid. A strategy to diminish the chance of reaching invalid conclusions when comparing multiple group means is analysis of variance.
Error 5, Is the underutilization of Analysis of covariance (ANCOVA), Multivariate Regression, Nonlinear Regression, and Logistic Regression, While most research and decisions are conducted using relatively straightforward experimental designs that are adequately handled with pair wise comparisons, ANOVA, or standard least-squares regression analysis, there are numerous circumstances in which more sophisticated statistical methods should be considered. For example, a research or analysis for decision making work with many independent variables requires multiple regressions to establish their relationship on the dependent variable rather than using ANCOVA. When there is more than one important covariate that could affect a particular outcome, the use of more complex regression analysis should be considered. In a multivariate regression, a least squares computational method is used for any number of variables in an attempt to account for the variation observed in the dependent variable. The variance due to an individual, independent variable is compared to the total variation in the data set and an F ratio is computed. If the probability of a larger F ratio is less than 5%, that variable is considered to be “significant” in explaining the variation in the outcome measure. This may not be following by many decision makers.
Another Peccadillo is reporting Standard Error Instead of Standard Deviation
Reporting standard error of the mean is perhaps not a sin at all; but, reporting standard deviation in place of standard error is a serious transgression. We all know that standard error is computed as the standard deviation divided by the square root of N, but this equation does not define the meaning of standard error of the mean. The standard error of the mean is the square root of the variance (i.e., the standard deviation) associated with the distribution of sample means that would be derived by repeatedly sampling data elements from the study population. Standard deviation is the square root of the sample variance and is, therefore, a direct measure of the spread of data in a sample. It is well known that two-thirds of the sample data points fall within one standard deviation of the sample mean and that 94% of data points fall within two standard deviations of the mean. International Journal of Humanities and Social Science.
This direct, easily conceptualized meaning of standard deviation makes it preferable when reporting descriptive statistics.
The practice of reporting standard error because it looks better” is a statistical sin. (Kuzon Jr., Urbanchek, & McCabe, 1996b) and cited by (Felix, 2015).
Another argument sometimes advance for reporting standard error is that one can easily determine, by looking at the overlap of standard error bars on graph, whether or not two means are significantly different. This belief is incorrect. It is easy to construct scenarios wherein two means will have values within one standard error of each other, yet they are significantly different statistically. It is also easy to construct the alternative scenario (bars don’t overlap, means are not significantly different). It is not possible to determine whether two means are significantly statistically different simply by looking at either standard deviation or standard error bars on a graph. Therefore because of its direct and easily understood meaning, we advocate the reporting of standard deviation as the parameter indicating the spread of the sample data.
Another peccadillo is the failure to rely on a Statistician or Relying too much on a Statistician, This is a double-edged sword. In its positive connotation, it indicates that the researcher has sought the expertise of a statistician to assist with the interpretation of data, an obviously desirable maneuver. It may, however, indicate that the researcher has little or no concept of the statistical methods being employed for the analysis of the data, preferring to abdicate all responsibility to a third party.
While there are times when statistical analysis may become extraordinarily complex, it is our opinion that it is the responsibility of the primary author or investigator to understand and to agree with the statistical analysis utilized. This may seem unfair, since one cannot become an expert on everything.
Nevertheless, if statistical analysis is to be used as a means of evaluating our research results and thereby use it to validate important decisions regarding patient management, we submit that it is a sin simply to “give data to the statistician” and then to get back “results.
3. Methodology
This section gives a detailed methodology approach, where the design principle is based on the response rates especially, where the whole country is involved like the presidential elections, the referendum over a key decision within the state. The design suitable for this study is analytical giving the details of the results based on the analysis.
The study adopted a simple one spot survey and analytical designs taking a case study of 7 small scale businesses. The study employed both quantitative and qualitative approaches. The study further, used a simple survey and interview methods for data collection and analysis.
3.1. Sample Size Determination
Because of the uncertainty of the total population (unknown population respondents), the sample size was determined using proportions formula:
where error term (E = 10% = 0.1), the value of Z = 1.645 as per Table 1, indicated here, stipulating the numbers of respondents.
P is the indicator value of response rate, bearing in mind that from the 2016, Feb 18, presidential elections the voter turn up was 63.5%, so p = 0.635, D is the Design effect representing the variations from SRS method of stratified samples (D2 = 1), q = (1 − p), implying 1 − 0.635 = 0.365: The number of the respondents in total was 63 people (n = 63).
3.2. Research Questions and hypothesis
The study answered the following research questions
1) How do you forecast the number of customers and sales volumes for a typical business day so as plan for the services?
![]()
Table 1. Number of respondents in the survey, interviews and Focus group discussions.
Source: Primary 2018.
2) What are the implications of your forecasting methods on your business performances over time?
3.3. Methods of Data Collection, Tools and Techniques
Data was collected using survey, interviews and focus group discussions.
3.3.1. Interview Method
The different stakeholders of the business enterprises were engaged into simple but comprehensive interactive interviews where their views and experiences were sought regarding the subject under study. In total of 15 interviews in all were conducted in the three categories of organizations.
3.3.2. Survey Method
A one spot survey was used to collect the relevant data from the respondents. The categories of respondents to who surveys were conducted included management and staff Focus 3.4.3.
3.3.3. Focus Groups Discussions
Focus groups discussions were conducted between the different respondents. In total 7 Focus group discussion conducted in the seven organizations.
3.3.4. Review of Documents and Reports
A number of reports and documentaries including journals, books and periodicals were reviewed with a purpose of linking the problem to the literatures.
3.3.5. Data Collection Tools
1) Interview Guides
Interview guides were the tools used to collect data from the different categories of respondents. Interviews were administered and free and fair responses were collected from the targeted categories of respondents.
2) Questionnaires.
Questionnaires with mainly closed ended questions were administered with a view of collecting specified responses in an easy way. The questionnaires were administered by the researchers and responses recorded as required. These questionnaires were generated by the researchers based on the problem and objectives of the study.
3) Focus groups discussions Guides:
Focus group discussions with were conducted with selected groups of 8 people each from the different categories of beneficiaries.
3.4. Tests for Validity and Reliability of Data Collection Instruments
The data collection instruments were subjected to validity and reliability analysis tests and the tools were proved fit for purpose to collect the required data for the study (For all attributes the results were over and above 0.7).
4. Data Presentation, Findings and Analysis
Data was analyzed using SPSS, and MS EXCEL especially for quantitative data and descriptive statistics.
4.1. Measurement of Variables
Quality of forecasting and decision making on key indicators as indicated in the tools.
A Likert anchor tool of Level of satisfaction in decisions made, with 6 Points was used
1: Absolutely not satisfied; 2: Not satisfied; 3: Neutral; 4: Slightly satisfied; 5: satisfied; 6: Absolutely satisfied.
4.2. Methods of Forecasting and Business Decision Making in the Organizations
The findings are based the 5 anchor Likert scale (1 - 5), 3 Likert scale and 6 Likert scales respectively,
The respondents were clustered and stratified according to the categories in Table 2; their responses were summarized and here below presented.
Forecasting: Anchor of 5 alternatives
1: Judgmental, 2: Market Research, 3: Time series, 4: Causal, 5: Combination of more than one.
Decision Making: Anchor of 3 alternatives.
1. Directive 2. Analytical 3. Conceptual.
4.3. Study Findings and Discussions According to the Variables under the Study
The respondents indicated that forecasting in their enterprises is both qualitative and quantitative, but with more of the quantitative dominating.
It was noted that most of the respondents indicated that their forecasting is more on time series where they look at the Moving average (Averages), Trend analysis and seasonality and little of exponential smoothing, also including casual methods which involve regression.
Table 2 gives a detailed and key finding from the responses of the different enterprises types under the three key categories.
These categories include institutions engaged in the financial sector, offering financial services, those institutions engaged in the construction industry and also those engaged in utilities sector like electricity, water and other related. Table 2 shows the forecasting techniques employed by the different categories of enterprises that were interacted with during the study.
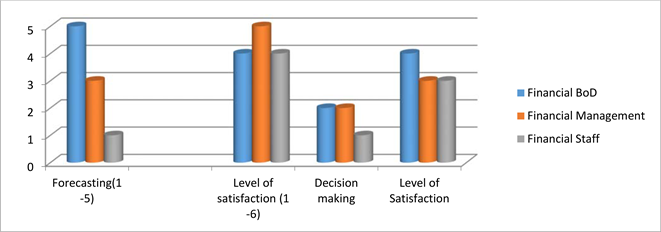
Graph 1 gives the different responses by the financial enterprises in regard to forecasting, levels of satisfactions, decision making by the different categories of staff ranging from Board of Directors, Management teams and the general staff.
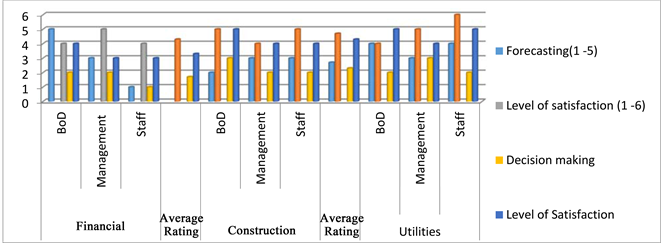
Graph 2 shows the different opinions of the categories of respondents as per
Source: Primary May, 2018.
Source: Primary 2020.
Graph 1. Financial enterprises (organizations’) responses.
Source: Primary 2020.
Graph 2. Financial, construction and utilities enterprises combined.
organizations types ranging from Financial institutions, Constructions, and utilities. Their opinions are ranked and summarized in Graph 2.
4.4. Qualitative Findings According to Interviews and Focus Groups Discussions
According to the personal interviews with the different categories of respondents about the forecasts, decisions made and levels of satisfaction, the following were key observations.
4.4.1. Forecasts and Flows: Views by Board of Directors, Management and Staff
The Directors in the three enterprises emphasized that forecasts are mostly based on historical performances and seasonal variations.
The customers come to deposit and withdraw from their accounts basing on seasons especially when there is bumper sales in agricultural produce a lot is deposited and when the school fees season is on a lot is withdrawn (Boardmember, 2020),
On the other hand it was observed that these forecast don’t necessarily follow normal distributions distinctly, however, parametric processes are followed despite the various contradictory assumptions, though not scientific in a way.
For the construction companies, most sales and customer flows are easily predicted during seasonal harvest, Christmas seasons and new year’s festivals where most clients flow in to purchase materials (CEO, 2018).
For Utilities, most of the flows are during the seasonal harvests especially in the rural areas, say for solar energy, electric installations and say water harvests and installations.
Most of our sales are under seasonal times and festival periods say for solar in rural areas, but for urban areas, there are no clear distinctions, so both normal assumptions and unpredictable ones are used (Staff, 2018).
In general the respondents confirmed that, the forecasts made by the enterprises are more of parametric in nature, though with diverging assumptions.
4.4.2. Decision Making and Levels of Satisfactions: Views by Respondents
On the issues of decision making in the enterprises, the different views were gathered.
Most decisions in the construction enterprises are directives especially when it comes to expenditures and investments in the construction companies (Staff, Decision Making in the construction comapnies, 2020a)
These decisions are mostly directives made by individuals especially the directors who own the companies, though guided sometimes by a few considerations.
Regarding the financial institutions, it was observed that most decisions were based and guided by both analytical and conceptual means.
Decisions on projects sales and flows are determined basing on the past records, market surveys and are mainly based on data analysis where budget figures are derived, carefully consider possible alternatives, rational and objective decisions made, however, sometimes as a team, consensus is reached (Marketing, 2020).
On the other hand, it was a necessary step to find out whether, the decisions made at all levels were really satisfactory and /or not to the different stakeholders in the different enterprises.
In the construction companies a few stakeholders discussed with indicated the different views.
We are not fully satisfied by the way some decisions are made, because there are very few consultations made in most cases it is the boss who says and all is done (Staff, Level of satisfaction on decion making, 2020c).
On the centrally in the utilities sector especially on the levels of investments, charges and quality of services, it is through analytical means and rational decisions made.
When it comes to how much to produce and quality specifications, staff are involved on a bottom-upward basis, then decisions are scrutinized before final levels and alternatives considered (Staff, Level of decsion making satisfaction, 2020b)
Financial institutions, levels of satisfaction on decisions taken are contradictory because stakeholders did not unanimously have a common stand.
From the management team, they urged that decisions taken were satisfactory because they are based on objective and rational analysis. However, with the lower carder staff, decisions taken were not satisfactory, because on a number of occasions there are very high projections compared to the real market forces.
We are given very high targets compared to what is really achieved throughout the year, yet management is aware some of the figures are unrealistic (Credit officer, 2020)
On the other hand the officers in cash especially were somehow not happy with the decisions, more so on the working hours and the numbers of clients served per day.
We work for long hours and we are given no time for break and this is because we are expected to serve over 200 clients a day. Start at 9.00 am and end at 7.00 pm. This is too much! (Cashier, 2018)
The basis of such decisions were not known to some staff which left some of them highly dissatisfied on decisions taken by high levels officials, especially managers and Board of Directors members.
5. Conclusion and Recommendations
It’s commonly thought that the need to choose between a parametric and nonparametric test occurs when your data fail to meet an assumption of the parametric test. This can be the case when you have both a small sample size and non-normal data. However, other considerations often play a role because parametric tests can often handle non-normal data. Conversely, nonparametric tests have strict assumptions that you can’t disregard.
The decision often depends on whether the mean or median more accurately represents the center of your data’s distribution.
· If the mean accurately represents the centre of your distribution and your sample size is large enough, consider a parametric test because they are more powerful.
· If the median better represents the centre of your distribution, consider the nonparametric test even when you have a large sample.
Finally, if you have a very small sample size, you might be stuck using a nonparametric test. Please, collect more data next time if it is at all possible! As you can see, the sample size guidelines aren’t really that large. Your chance of detecting a significant effect when one exists can be very small when you have both a small sample size and you need to use a less efficient nonparametric.
From the findings, it was noted that most forecasts did not meet the criteria of assumptions made for parametric and non-parametric tests.
5.1. Basis of Forecasts
Under the forecasts made, most of the respondents could not confidently establish whether the distributions for basis of forecasts, were known, instead most of them were arbitrary, which meant that nonparametric tests and processes were called for. However, when asked basis of forecast, the respondents had parametric where they mentioned the means, averages and yet they could not establish the populations of their clientele.
Findings revealed that most of the variables were and attributes were nominal and ordinal, yet most of the tests, processes were mostly parametric instead of nonparametric, where even correlations used were mostly Pearson’s instead of spearmen.
In the financial institutions, they have clues on the clientele although not fully. So use of estimated numbers of performances based on trends was appropriately used.
The forecasts and trends of performances in financial institutions were based on both variables and attributes, so non parametric tests were appropriate, but you would find that parametric tests were used instead of nonparametric, for example, the clients by sector, by sex are known and even their characteristics.
5.2. Decisions Making and Level of Satisfactions
Decision making in all enterprises is not yet to the levels required, although some are satisfactory.
However, where analytical and conceptual decisions are taken, it is a good practice.
There were errors were observed in the different enterprises, however, the ones below were rampant.
1) The parametric analysis for ordinal data.
2) The inappropriate use of parametric analysis in general.
3) The failures to employ analysis of covariance, multivariate regression and nonlinear regression, and logistical regression in their data analysis.
4) The habit of reporting wrong standard errors and misreporting of standard deviation.
5) There was under use of statistical consultation.
5.3. Recommendations
From the study findings, I wish to recommend the following:
1) Non parametric analysis should be used especially for ordinal data, where organizations are not aware of their total clientele.
2) Enterprises should take care especially when using parametric analysis in general, because they end up making wrong conclusions in forecast and therefore affect their decisions, especially when it comes to investments and decision making.
3) The bottom-up approaches should be used whenever forecasts and decisions where non parametric data is dealt with.
4) Enterprises should consider employing analysis of covariance, multivariate regression and nonlinear regression, and logistical regression in their data analysis
5) Enterprises need to take care whenever reporting wrong standard errors and standard deviation to avoid portraying wrong basis for decision making.
6) There is need to apply of statistical consultations especially when forecasting and flows.
6. Article Deficiencies
The article is considering the inferences based on statistical tests, which are both parametric and non-parametric in nature.
For future research, considerations could be made on other possible tests, especially qualitative tests other than quantitative and statically in nature.