1. Introduction
Biomass-sourced fuel such as Bioethanol is one of the emerging bioenergy sources presently being exploited in Nigeria. Nigeria as a nation depends heavily on crude oil as the major energy source, while other energy-potential resources are minimally focused.
Yearly, 94% of the energy consumed in Nigeria is sourced from fossil fuel, notably, petroleum [1]. The continuous utilization of this resource over years has adversely contributed to the numerous environmental pollution challenges encountered in the nation. Presently, research attention is being focused on harnessing other energy sources to circumvent the unpleasant consequences of pollution associated with petroleum exploitation. Hence, one of the major areas of research interest is biomass conversion technology. Biomass is generally considered as a dependable alternative resource due to its inherent advantages such as sustainability, renewability, availability, affordability and environmental friendliness [2].
Biomass is an organic material that contains radiant energy stored from the sun. The energy can be harnessed for both domestic and industrial purposes if effective biomass conversion technology is put in place [3] [4].
Plantain is one of the most important crops of the tropical plants. It belongs to the family Musaceae and the genus Musa. It is known as, “Ogede agbagba” in Yoruba, “Ayaba” in Hausa and “Ogadejioke” in Igbo [5]. Plantain is a common food crop grown in many countries of the world.
Nigeria is one of the largest economies that cultivate plantain. About 2.73 million tonnes of Plantain is being harvested annually and the post harvested biomass remnants dispersed unproductively [6]. Plantain is majorly produced in the South and Central regions of Nigeria [7] [8].
Plantains and other cooking bananas produced throughout the humid tropics constitute major source of carbohydrates and contribute enormously to global food security essentially in Africa, Caribbean, Latin America, Asia and the Pacific. Due to the perishability nature of the crop, the rate of postharvest losses varies from one country to another according to the organisation of market chains and modes of consumption [6]. The lignocellulosic biomass is made up of very complex biopolymers comprised of cellulose, hemicellulose, and lignin and small amount of extractive and mineral acids [9].

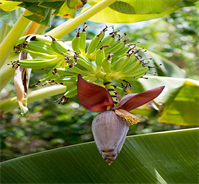
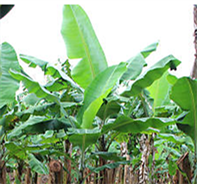
Plantain Inflorescent flower Plantain Stem Plantain leaves
2. Materials and Method
2.1. Sample Collection and Preparation
Plantain (Musa paradisiaca L.) post harvested biomass was collected from Plantain orchard of the Federal University of Technology, Akure (FUTA), Nigeria. Samples were separated into three portions, labelled as stem, leaves and flower and washed with water to remove every dirt adhered. The samples were sun-dried for 5 D and ground into fine particle size using milling machine. The milled samples were made to pass through 1 - 5 mm size analytical sieve.
2.2. Determination of Fibre Composition
The extractives, lignin, holocellulose, alpha-cellulose, hemicelluloses, moisture and ash content were determined by using standard method as described by TAPPI-204-cm-97, TAPPI-222om-02, ASTM D1104-56, ASTM D1103-60 and ASTM E871-82 respectively [9] - [15]. The hemicellulose was determined by the difference between holocellulose and alpha cellulose. All analyses were performed in triplicates.
2.3. Acid Hydrolysis
The hydrolysis experiments were conducted using both the laboratory scale reactor and fabricated percolating hydrolysis reactor.
2.4. Hydrolysis Using Laboratory Scale Reactor
The laboratory-scale hydrolysis reactor was set up using a pressure pot assembled with a digital thermometer. The first batch of the hydrolysis experiment was conducted using the reactor as follows:
One gram (1 g) each of the plantain biomass fractions was hydrolysed under the following experimental conditions of temperature ranging from (80˚C, 100˚C, 120˚C) acid concentration (2%w/v, 4%w/v, 6%w/v, 8%w/v and 10%w/v) and contact time (30 min, 60 min, 90 min, and 120 min).
2.5. Hydrolysis Using Fabricated Percolating Reactor
Five hundred (500) grams of stem, leaves and flower of the prepared biomass samples were weighed, transferred into separate plastic buckets, stirred thoroughly and introduced into the fabricated reactor for bulk acid hydrolysis. Optimum hydrolysis conditions of acid concentration (6%w/v H2SO4), temperature (80˚C) and contact time (90 min) were adopted for plantain stem and flower biomass. The same procedure was adopted for plantain leaves biomass at the optimum conditions of 10%w/v acid concentration, temperature of 120˚C and contact time of 120 min.
At the end of the acid hydrolysis reaction, the mixture was allowed to cool for 1h and filtered. The residue was kept in refrigerator for SEM analysis. The pH of the hydrolyzates was monitored with pH meter and regulated using 6 mL of 2 M NaOH to attain a pH of 4.5 which was conducive for yeast cells.
2.6. Preparation of Baker’s Yeast (Saccharomyces cerevisiae)
Saccharomyces cerevisiae (120 g) was weighed and added to 100 mL of distilled water at a temperature of 20˚C in a sample bottle and agitated on a shaker at 300 rpm for 30 min to activate the yeast prior to use.
2.7. Fermentation of the Hydrolyzed Biomass
The fermentation of the hydrolyzed biomass was carried out as described by Ogunsuyi and Badiru (2016). The prepared Saccharomyces cerevisiae was then added to the hydrolyzed biomass, thoroughly stirred and covered with aluminium foil paper and kept at a temperature of 32˚C in a dark cupboard for 4 - 5 D [16]. The mixture was stirred on daily basis and the ethanol level produced was monitored using Alcohol hydrometer method [17].
2.8. Distillation of the Fermented Biomass
At the end of the fermentation, the fermented broth was distilled using a simple distillation method. The bio-ethanol distillate was collected at 78˚C method described by (Ogunsuyi and Badiru 2016).
2.9. Purification of the Distilled Liquor
The distillate was purified and collected over a temperature range of 78˚C - 78.5˚C using synthetic CaO to remove water and other extraneous impurities. Hence, a yield of 40 mL of the pure bio-ethanol was obtained. The bio-ethanol was kept in an airtight bottle in a refrigerator prior to FT-IR analysis to determine various functional groups contained in the liquor. The bio-ethanol yield was calculated and recorded.
3. Result and Discussions
3.1. Fibre Composition of the Plantain Biomass
Table 1 shows the results of the fibre components of the various fractions of the biomass (flower, stem, leaves). The result showed that extractive contents were 26.56%, 22.04% and 33.71% for flower, stem and leaves respectively. Lignin contents were found to be 46.00%, 28.00% and 27.00% for flower, stem and leaves respectively. The results were consistent with the value reported by Bilba et al., (2007) for banana leaves [18] [19] and for pseudo-stem reported by Abdullah et al., (2014). Holocellulose content was noted to be 55.00%, 70.30% and 63.30% for flower, stem and leaves. While the α-cellulose contents were found to be 33.00%, 29.00% and 30.00% for flower, stem and leaves respectively. It was observed that the values were not in agreement with the finding of Kabenge et al., (2018). This discrepancy could be attributed to the varied chemical composition of the agro-waste [20]. Hemicellulose contents were recorded as 22.00%, 41.30%, 33.00% for flower, stem and leaves respectively. The results compared favourably with the observation of Kabenge et al., (2018) reported for hemicellulose content of Plantain pseudo-stem and leaves. Moisture content of 5.68%, 6.44%, 7.60%
![]()
Table 1. Proximate and fibre composition of the plantain biomass.
were noted for flower, stem and leaves. This is in agreement with the findings of Abdullah et al., (2014) reported for banana leaves [19]. Ash content was 16.00%, 15.66% and 19.00% for flower, stem and leaves of the biomass. The value of the ash content in the samples contributed to good performance during fermentation and pyrolysis [21].
3.2. Variation in the Brix-Level at Different Acid Concentrations during Hydrolysis
Figure 1 shows the variation of brix levels at different acid concentrations. The hydrolysis experiment monitored at a temperature of 80˚C and contact time of 30 min, showed the highest brix level of 14%w for Plantain flower, 8.5%w for Plantain stem and 12.5%w for leaves. As the brix level increased with increase in acid concentration, there was a gradual decrease in the brix level at 6%w, the reason for this trend was as a result of the emergence of degradation products such as Hydroxymethylfurfural (HMF), formic and levulinic acid which did not favour the release of monomeric sugar. The gradual rise in the brix level after 6%w could be explained on the basis of the indiscernible of the degradation products present in the hydrolyzate at a higher acid concentration than 6%w.
Figure 2 shows the variation of brix level at different acid concentrations. The hydrolysis monitored at 80˚C temperature and 90 min contact time showed the highest brix level of 7.5%w of plantain stem, 6%w of plantain flower and 11.5%w of plantain leaves biomass.
Figure 3 shows the variation of brix level at different acid concentrations. The hydrolysis monitored at 120˚C temperature and 120 min contact time showed the highest brix level of 14%w for plantain flower, 13%w for stem and 13.5% for leaves biomass. The reason behind the trend exhibited by the curves is in line with the finding reported by Hernandez et al., (2013) for sulphuric acid pretreatment of Moringa oleifera empty pod [22]. However, for effective release of sugar for quantitative fermentation, hydrolysis conditions of 6%w/v acid concentration, 80˚C working temperature and 90 min contact time were the established optimum conditions for plantain stem and flower, while optimum conditions of 10%w/v acid concentrated temperature of 120˚C and contact time of 120 min were suitable for plantain leaves biomass.
![]()
Figure 1. Variation in the brix level at various acid concentration of 80˚C temperature and 30 min contact time.
![]()
Figure 2. Variation in the brix level at various acid concentration of 80˚C temperature and 90 min contact time.
![]()
Figure 3. Variation in the brix level at various acid concentration of 120˚C temperature and 120 min contact time.
3.3. Yield of Bio-Ethanol Produced
Table 2 shows the percentage (%) yields of the derived bio-ethanol. The highest yield of bio-ethanol produced was from plantain stem of 8.04% followed by plantain flower of 7.73% and plantain leaves of 7.57%. The relatively high yield of bio-ethanol obtained from plantain stem can be attributed to the hemicellulose content of the stem fraction of the biomass which is comparatively higher
![]()
Table 2. Percentage yield and density of the derived bio-ethanol.
than those of other fraction (Plantain flower and leaves) as shown by the fibre analysis reported in Table 1.
The Percentage (%) yield of the derived Bio-ethanol was calculated using:
(1)
where;
W is the weight (Yield) of the Bio-ethanol and
V is the Volume of the Bio-ethanol
Density of ethanol given as 0.789 g/cm3
and
(2)
M is the mass of the biomass used.
3.4. Comparison between the Fuel Properties of the Derived Bio-Ethanol and Conventional Ethanol
Table 3 shows the fuel properties of the derived bio-ethanol and the conventional ethanol. The molecular formula, boiling point, pH, appearance, colour and flavour compared favourably with those obtained for the conventional ethanol. The specific gravity for stem, flower and leaves of the derived bio-ethanol was comparably higher than those of the conventional ethanol. Values obtained for the refractive indices of the plantain stem, flower and leaves derived bio-ethanol were observed to be 1.349, 1.348 and 1.351 respectively. The flashpoint was observed to be 46˚C, 44˚C and 40˚C for stem, flower and leaves derived bio-ethanol. These values compared favourably with the findings of Ogunsuyi and Badiru (2016) for bio-ethanol produced from cocoyam and sweet potatoes [16]. This showed that the derived bio-ethanol have a good ignition ability.
3.5. Structural Determination of the Derived Bio-Ethanol Using Fourier Transform Infrared Spectroscopy (FTIR)
Figures 4-6 show the FT-IR spectral of the derived bio-ethanol of flower, stem and leaves in the following absorption regions.
From the spectrum in Figure 4, O-H functional groups were observed at the absorption region of 3431.0 cm1, 3398.0 cm−1 and 3395.0 cm−1 respectively for plantain flower, stem and leaves. These regions correspond to O-H stretch of alcohol. Absorption region at the peak areas of 1638.68 cm−1, 1640.77 cm−1 and
![]()
Table 3. Fuel properties of conventional ethanol and the derived bio-ethanol.
![]()
Figure 4. FT-IR spectrum of the derived plantain flower bio-ethanol.
![]()
Figure 5. FT-IR spectrum of the derived plamtain stem bio-ethanol.
![]()
Figure 6. FT-IR spectrum of the derived plantain leaves bio-ethanol.
1651.17 cm−1 indicated C-H stretch of alkane.
Figure 5 and Figure 6 at the absorption bands of 1046.17 and 1049.50 cm−1 for the plantain stem and leaves indicated C-O stretch of alcohol. Figure 5 and Figure 6 at absorption band of 2988.08 cm−1 and 2976.38 cm−1 indicated C-H stretch alkane.
3.6. Surface Morphology of the Pre-Hydrolyzed and Post-Hydrolyzed Plantain Biomass Using Scanning Electron Microscope (SEM)
Plates 1-3 reveal the effect of the acid hydrolysis on the surface morphology of the biomass before and after the hydrolysis.
 (a)
(a) (b)
(b)
Plate 1. (a) SEM of pre-hydrolyzed plantain flower biomass; (b) SEM of post-hydrolyzed flower biomass.
 (a)
(a)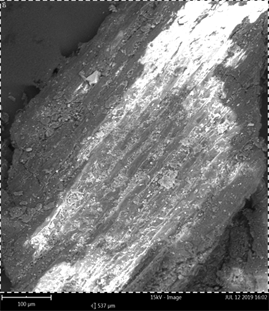 (b)
(b)
Plate 2. (a) SEM of pre-hydrolyzed plantain leaves biomass; (b) SEM of post-hydrolyzed plantain leaves biomass.
 (a)
(a)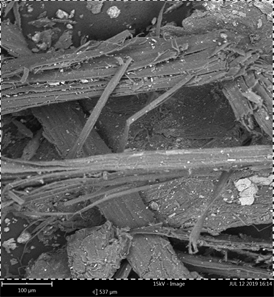 (b)
(b)
Plate 3. (a) SEM of pre-hydrolyzed plantain stem biomass; (b) SEM of post hydrolyzed plantain stem biomass.
The Pre-hydrolyzed Plantain flower possessed smooth flat surface (Plate 1(a)). Pre-hydrolyzed Plantain leaves biomass (Plate 2(a)) possessed stony-like pattern with an amorphous surface. Pre-hydrolyzed Plantain stem (Plate 3(a)) biomass possessed rough fibre look pattern. The Post hydrolyzed biomass (Plate 1(b), Plate 2(b) and Plate 3(b)) all possessed short stranded scattered region. This observation was a result of H2SO4 during acid hydrolysis which disrupted the G S H unit of lignin releasing monomeric sugar (Hemicellulose) necessary for fermentation process [23].
4. Conclusion
Preliminary fibre composition analysis conducted on the biomass revealed the promising potential of plantain biomass due to its high hemicellulose content. The optimum hydrolysis conditions were established for plantain stem and plantain flower at acid concentration of 6%w/v, temperature of 80˚C and contact time of 30 min while plantain flower was optimally attained at the hydrolysis conditions of acid concentration of 10%w/w, temperature of 120˚C and contact time of 120 min. The highest yield of bio-ethanol produced was from Plantain stem biomass with a value of 8.04% followed by Plantain flower biomass with 7.73% and Plantain leaves with 7.57% respectively. FT-IR spectral clearly indicated OH-stretch band in all the bio-ethanol produced which confirmed the conversion of the fermentable sugar that produced the ethanol. The SEM analysis confirmed the effectiveness of the acid hydrolysis scheme adopted for the study.