Why the Perfect Timing Achieved by the Managers of Shipping Companies is so Important? ()
1. Introduction
“Timing of decisions” is very important for Shipping Industry, as this will be shown. But what exactly we mean by timing? Timing is a skill, obtained by learning or practicing. It is the ability to take perfect decisions in time. However, for the people who are not managers, timing may appear in degrees: bad, good, very good etc. Surely, no one is perfect, but God!
The successful shipping management, however, is the only one, which applies perfect timing…Time is the king in shipping industry. Moreover: “should all management decisions be taken within a perfect timing”? The answer is yes, but certain decisions are so decisive, and their impact many times so greater, so that managers have to give their priority and their utmost focus.
But “why timing is so important”? Because taking a decision at the wrong moment, the cost involved for the company, may be higher, and the benefit derived from it, may be lower, or even negative! This means that timing has to take at least only those decisions, which provide the maximum benefit, in time, by paying the minimum cost, at times, and at all times!
Our experience from the management of Greek-owned shipping companies is that their managers dispute their own ability of forecasting the markets, in which they do business in. In addition, this dispute is not only a belief among shipping managers, but also among maritime economists, like the leading one Martin Stopford.
If forecasting is not available, or possible, then, we believe, perfect timing is the second best. In other words, we expect, by perfect timing, to “build and/or buy ships when their prices are at rock bottom, and their prospect, on their delivery, is a high freight market (basic principle)”! This is, no doubt, a skill of how to kill two birds with one stone…but this is easier than a deceptive forecasting.
The above basic principle, when it was not respected, led a shipping company to bankruptcy (“Colocotronis” Shipping Company) or to face great difficulties (“Sanko” shipping Company of Japan; “Eletson” Shipping Company). As a result, the ability to forecast had to be replaced by the ability of recognizing the rock bottom prices and the prospective good freight rates.
This paper aims at helping Greek shipowners, empirically, in case when forecasting is not possible. But one may argue that this is not a scientific method and this paper keeping distances from forecasting, it may be judged as a very elementary manuscript... But the answer is that Greeks (e.g., Procopiou, mentioned below) became top ship-owners using the methods described here! Thus, it is better to become a top manager using empirical methods, than to fail following unreal theoretical ones. This is our contribution on top of our many and repeated attempts to forecast freight markets.
2. Aim and Organization of This Paper
The purpose of this paper is to teach the reader how to apply perfect timing being a manager, (of a shipping company), by providing a number of actual examples. We will cover the perfect timing of the big 8 big shipping decisions: 1) building and 2) buying, vessels, chartering them in 3) spot or 4) time-charters, 5) borrowing from banks or 6) Stock exchanges, 7) buying larger and 8) younger ships.
The paper is organized in five parts, after literature review. Part I deals with the fact that forecasting is disputed by Greek Shipowners. Part II deals with the structural decisions requiring Perfect Timing. Part III deals with the issue whether to have ships in spot or time charters. Part IV deals with the remaining cases for a Perfect Timing, except to launch an IPO. Part V deals with timing to float. Finally, we conclude.
3. Literature Review
One is surprised when he/she finds-out that “timing”, as a research subject, is found rarely in economics and management, despite its importance. True that scientists tend to exclude timing...from their analysis. There are, however, few phenomenal exceptions: Einstein (1905), defined time indirectly as:
.
Chaos theory also embodied time in its difference or differential equations.
Porter (1985), argued that timing can be a source of sustainable cost advantage, because it is often hard to replicate (p. 112). Our definition presented in the introduction showed that timing is a skill, which has to be acquired by all shipping managers. He deals with timing in connection with applying it before somebody else does like a competitor being a 1st moving industrialist1. In shipping industry this corresponds, we believe, to serve specific geographical areas, or owning ships of a larger size than hitherto by competitors, or having ships with stronger cranes or decks or serve a market niche (“StealthGas”).
Porter (1985) also argued that technology creates opportunities for timing advantages (p. 170). More important is that he considers timing as a cost driver, affecting the differentiation2 cost (p. 128)3. In addition, he mentioned scale in the above 7 factors. Scale makes particular sense in shipping companies by having a serious bearing on average operating cost (“General Maritime Corporation”; “Onassis”).
Dixit & Pindyck (1994), were the first to deal in length with the important issue of “how to invest in an uncertain world”, determining the state of art of timing.
Jennings & Wattam (1998) raised the question of how timing is used when business decisions are made: 1) Time is spent to operate the information and communication processes. 2) Time is spent in selling the decision. For them, decision-making is an activity that lies at the heart of management4.
Economists indicate no time in their equilibrium endeavors and replaced it with unrealistic economic periods, as argued by Marshall A. (1920: p. 289, chap. V), like short run, long run etc. Marshall’s methodology was also adopted by Stopford (2009: pp. 163-168) in maritime economics. Economists excuse themselves by arguing that they do not have… enough “dimensions” to insert time in their analysis…
McConville (1999) understood the need of the existence of time in his maritime neo-classical analysis, and borrowed a figure from the Japanese maritime economist Shimojo, who also felt this need, 20 years before him (Figure 1).
In Figure 1, time is introduced into the freight rate determination (Shimojo , 1979; McConville, 1999: pp. 253-254). As shown, time created 3 different freightrates: F1 < F < F2, because the 3 supply (S, S1, S2) curves and the 3 demand ones (D, D1, D2) shifted and crossed in 3 different points of time: T, T1 and T2, and created 3 equilibrium tonnages: Q < Q1 < Q2 , due to increases in demand.
Goulielmos & Goulielmos (2009) argued that the perfect timing should be attempted when supported by forecasting, using the better available method for prediction. They thus applied “Rescaled Range Analysis” (Chaos Theory). They have concluded that their forecasting, inside the sample, of the “Baltic Panamax Index”, gave accurate measurement for the near future, but not for the very distant one…
Some authors, however, argued that even a non-accurate forecasting is better than no forecasting at all, and mentioned a paper (Goulielmos & Psifia, 2009), where the forecasting of the weekly freight rates, of 1 year time charter, of a 65,000-dwt bulk carrier, between 1989 and 2008, and for 8 weeks ahead, deviated by less than 1% maximum from actual! In addition, Goulielmos (2018) devoted a paper to upgrade the importance of time in economics, in general, and in shipping economic analysis, in particular.
Dixit & Pindyck (1994), mentioned above, followed by Amaran & Kulatileka (1999) and Kellogg (2010). Besanko et al. (2013: pp. 234-235), we believe, described the state-of-the-art of timing, by asking: “What is the best time to make a strategic investment when one manager is faced with uncertain conditions about it?”
They placed the matter of timing as follows: “What a decision-maker to do, who is supposed to have the opportunity to tailor a decision, but to future information, which now is unknown”? But this is again based on forecasting! It is also based on delaying a decision to increase one’s degree of certainty! This means that the investment decisions are distinguished in: a) those having the option to be delayed for more certainty, and b) those that can be characterized as “now-or-never”. In shipping investment decisions are “either now”, or “never”!
In shipping we have such a case occurred also in other international companies5 when an entrepreneur in “Cruising Shipping” wished to invest in “Greek international coastal shipping”, connecting Greece with Italy, but his knowledge was limited about this market (high degree of uncertainty). He then bought a number of shares in such a company and asked for a desk in the company as a minor shareholder. He was entitled to have electronic access in company’s information system for 4 continuous years. He learned all he wanted, he sold his shares and when the company listed, he bought most of it, through Athens Stock Exchange.
Robbins and Coulter (2018: p. 672) mentioned time in relation to PERT network, which is a flowchart diagram showing the sequence of activities of a manager needed to complete a project, and the time (or cost) associated with each activity… Management (Robbins & Coulter, 2018) argued that nowadays all decisions are strategic and there is no certainty in business anywhere during the last 30 years or so.
Smet De et al. (2017), wrote about how to make faster and better decisions using 3 keys: more data; more proper analytics and a clearer understanding of how to mitigate the cognitive biases. Smet De et al. (2019) conducted a survey with more than 1200 global managers. Less than 50% said that decisions were timely! The authors determined the time and the cost of making an ineffective decision. Managers at a typical Fortune 500 company may waste more than ½ a million days per year on ineffective decision-making!!
Summarizing, the sources mentioned indicate that either forecasting is not possible, or time has to be ignored, or uncertainty, and not timing, should be recognized as the issue. If uncertainty is the real problem, then science recommends to find ways… to reduce it, one of which is to wait or evaluate the real options (common sense)! Another recommendation is to “obtain” an inside information by making a small inside investment, before the big one, to increase knowledge. Volatility, surely, makes knowledge more limited.
Our paper, however, is different, as it introduces a “win-win” policy at a perfect timing provided that managers are skilled where the knowledge of project’s profitability is not required, market uncertainty, in general, does not matter, neither waiting is recommended. Only recognizing the rock-bottom asset prices and applying economies of scale…In other words, investing in those assets that will make one’s more competitive than he/she was, in an uncertain, volatile and unpredictable maritime world!
4. Part I: Forecasting is Disputed by Top Greek Shipowners!
Worth mentioning is the following statement made by one most successful Greek shipowner, i.e., Mr. Procopiou G. (Scan 1), where he openly asked from other shipowners to ignore the analysts. We know that Greeks have a strategy in building and buying ships (Goulielmos , 2020), which aided them to reach and stay on top of international shipping for decades, using no forecasts at all…
As shown, the Greek shipowner Mr. Procopiou G., recommended in 2016, in fact, to ignore the forecasts… But more interesting is his following statement: “Shipping is the most stable business, because it is stable in its instability”. “The volatility is how you make profits, and timing is the key” … This statement seems to be Pythia’s oracle, but it is not. It means that in shipping a shipowner must distinguish the stable factors, from the unstable ones, and apply timing on the basis of the former. We fully agree with Mr. Procopiou G. This paper shows that his opinion can also be supported by shipping economics and it is more empirical.
The position of the Greek-owned shipping in 2018 is shown below (Figure 2).
As shown, the Greek-owned fleet is on top of the first 10 nations, with 18% share in the 1350 m total dwt, and 16% in total 27,700 ships. Table 1, indicates who is stronger among the 10 top shipping nations.
We reckon that the stronger shipping nation is not the one having more ships,
![]()
Source: Lloyd’s List, 7/06/2016, modified.
Scan 1. A leading Greek shipowner recommends in 2016 Poseidonia.
![]() Source: BHMAgazino, Shipping issues, 2018.
Source: BHMAgazino, Shipping issues, 2018.
Figure 2. Position of the Greek-owned shipping, 2018.
![]()
Table 1. The economies of scale among the 10 shipping nations, 2018.
Source: Figure 1; (*) above world’s average; (**) flag of convenience.
or tons, but that which owns the larger average size, and this is Greece, followed by Hong-Kong and Japan. This phenomenon, i.e., to own larger ships than one’s competitors, is shown also, more impressively, among Greek-owned shipping companies (Table 2).
As shown, the protagonist, in ship sizes, is company “Gener8 Maritime”, (partly) owned by Peter Georgiopoulos-PG, chairman of 2 additional NYSE registered shipping companies. 1) General Mar. Corp.-GM, dealing with large crude oil carriers, listed in 2001, with a capitalization, in early 2009, of $870 m (PG owned 13.7%). 2) Genco Ship. & Trading, dealing with dry bulks (a better sector in 2009 and before) and capitalized at $2b at NYSE since 2005 (PG owned 13%). 3) Aegean Marine Petroleum Network (NYSE 2006), which deals with special purpose tankers supplying fuel to other ships, capitalized at $1.8b (PG owned 10%) (source: Lorange, 2009: pp. 188-189). We see a sectorial specialization in these 3 above companies.
Moreover, the share of Greece in EU was more than half: 53%. Greece serves the 22.5% of trade from/to USA and 20.3% of the trade from/to Europe in 2018. As shown, the 10 top Greek shipping companies had an average size, above the Greek-owned fleet as a total, of about 77,000 dwt. For comparison, the 100th Greek owned shipping company had an average size of 27,223 dwt.
5. Part II: The Shipping Structural Decisions Deserving Perfect Timing
We will focus next on all important shipping decisions deserving Perfect Timing as shown below (Graph 1).
![]()
Table 2. Average size of the fleets of 10 top Greek shipping companies, 2016; 2018
Source: MIS, Greece.

+Source: Author.
Graph 1. Shipping decisions par excellence important for timing.
As shown, the most essential decisions are mentioned, which are all … closely related to timing! We plotted also and one box for factors that possibly we have left-out and we will mention them in what follows.
5.1. The Financial Costs
We will start from something simple, but essential: the financial cost. Shipping companies when borrow money from the banks, they pay a certain % (called spread) on top of the interest basis: the LIBOR6.
As shown, the 6-months LIBOR, for $ deposited in Europe, and lent to shipping, for a medium term, varied from 9% in 1990 to 3% in end-1992 and 7% in 1995. The perfect time to borrow is obviously at the end-1992.
Assume now that a shipping company borrowed $100 m at 9% plus 2% bankers’ profit (spread), i.e., at 11%, for 4 years in 1990. The interest cost7 is about $25 m. In calculating interest, this is done at the end of the period and at the remaining unpaid amount. Suppose now that the same company borrows at the end-1992, the same amount of $100 m. This time the interest rate is 3% + 2% = 5% and the interest cost is $11.5, i.e., $13.5 m less than in the first case!
Certain companies try an IPO (initial public offer), instead of a bank loan, where there is no interest, but a dividend payable after 3 months at the earliest. If there is a difference between the 3-months, 6-moths or 12-months LIBOR, the company has to choose the lower (Figures 3-5). Thus, the more frequent are the installments, the less will be the interest cost.
As shown, the 3-months LIBOR varied from 10.5% (08/03/1989) to 0.29% in 16/02/2012. In 16/01/1990 the rate was 8.25% and in 03/09/1993 3.19%, and thus there is a small difference of 0.19% from the interest rate charged for six-months (Figure 3). The perfect timing to borrow is apparently in 2012-17.
The 12-months LIBOR is as follows:
The 12-months interest rate basis-LIBOR varied from a high 9.7% in 1989 to 0.58% in 2014. The perfect timing to borrow is apparently from 2009 to 2020 (except 2019), at a rate below 2%! Global financial crisis apparently had a beneficial impact! Also, the Pandemic brought a few positive developments, apart from cheaper oil and reduced pollution. Greece e.g., borrowed $2.5b in end-Jan. 2021 at a negative interest rate!
Borrowing, of course, is not an end per se, but the borrowed money has to be
![]() Source: modified from that in Stokes (1997), pp. 120-121.
Source: modified from that in Stokes (1997), pp. 120-121.
Figure 3. The 6-months Eurodollar LIBOR, 1990-1997.
![]() Source: data from MacroTrends.
Source: data from MacroTrends.
Figure 4. 3-months LIBOR, 1986 (02/01)-2020 (03/09) (daily closing values).
used for a project to provide a net return above 2% + x% for 6 - 8 years (2% + x% = cost of borrowing)! In a global pandemic, as now, the present value of the future long-term profit % is expected to be below the cost of money %, plus a risk %, which is now high, times a low level % of confidence. The maritime indicator (BDI e.g.) allows to have no hopes for a recovery. But timing is above pessimism as Procopiou stated in 2016: “buy now and buy cheap” (Scan 1)! Buy ships under a Pandemic crisis…? Is this a serious advice from a top Greek shipowner?
![]() Source: data from MacroTrends, January of each year.
Source: data from MacroTrends, January of each year.
Figure 5. 12-months LIBOR, 1986-2020.
It goes without arguing that small loan-amounts, quickly repayable, or no borrowing at all, are preferable. Though banks and stock exchanges undertake the greater % of risk of a shipping project, if they finance more than 50% of the market value of the project -as actually do (by undertaking the 60% or 80% on new-buildings) they become partners, and in default times, they may become owners8…
Clever shipping companies constantly pay attention to financial cost and always try to find-out the cheapest finance source, i.e., the “rock bottom interest rates”. Moreover, whenever possible, shipping companies replace loans with high interest rates by ones with lower. Also, they raise money from stock exchanges to repay-out expensive bank loans. In addition, they try to extend tenor with bank loans during bad times (depressions) through a re-negotiation. As a corollary, we may say that shipowners have to insert a clause in their loan agreement that whatever balance is due can be repaid at any time, together with the accrued interest, and at will.
Elsewhere, we have suggested even unequal loan installments based on the real cash flow of a shipping company, along with the prevailing shipping cycle, to avoid defaults: say a % of gross earnings. Apropos, Goulielmos (2021) argued that banks and Stock exchanges unfortunately do not understand the fact that shipping cycles…and volatility, are useful phenomena!
5.2. Perfect Timing in Building or Buying Ships
Here we apply the same rule as above: “rock bottom interest rates & rock-bottom prices”! So, if one buys or builds a vessel at the rock bottom prices, he/she has also a rock bottom depreciation. Depreciation is another form of sharing company’s profits with shareholders, or it is company’s saving, and its level depends on the level of the purchase or building price! Shipping companies must adopt a depreciation strategy! And a dividend strategy. What we reckon more difficult is to borrow at rock bottom interest rates, when prices are also such...?
We saw above that the benefit of a lower interest rate is $13.5 m for $100 m loan over 4 years. What is the benefit of perfect timing related to ship prices? We will examine it now, i.e., if the time series of the interest rates coincide with that of ship prices (Figure 6) to draw a safer conclusion.
As shown, the rock bottom ship prices emerged in 1985, and not in end-1993, where interest rate was at rock bottom level (3%)! This is so because the rate of interest is determined by the supply and demand for money (Graph 2), while ship prices are determined by supply and demand for a ship space, based on seaborne trade (demand) and on the supply of newly built ships! The above Figure 6 reveals also the possibility of a clever in buying ships strategy! To buy
![]() Source: author.
Source: author.
Figure 6. Prices of a newly-built bulk carrier 60,000 dwt and its sister of 5 years old 2nd hand, 1976-1993.

Source: author.
Graph 2. Interest rate determination.
(always) 2nd hand ships, and never build ones! Why? Because the price difference is at $14 m at times (in 1978 e.g.), between a new and an old ship, while the technology remains about the same in 5 years! This is what told me a Greek shipowner.
If one builds a ship in 1993, he/she would pay $29m, instead of $12 m in 1985. Thus, one will pay $17 m more. Suppose now that one borrows 60% of this price of $29 m, i.e., 17.4 m, at 11% for 4 years, to be re-paid in 8 six-months installments. The interest cost is $4.34 m. Obviously, the benefit from the lower building price of $17 m is four times higher than the total interest cost.
Moreover, the capital cost is near 50% of the total cost; shipping companies plan so that to recover ship’s price in say 15 years, discounted at company’s rate of return on capital, or their cost of money. Now, as far as the ship prices are concerned, perfect timing is in 1985, for both newly built and 2nd hand ships.
It is useful, however, to know that behind ship prices are freight rates (Figure 7).
As shown, 1986 created rock bottom freight rates, which have caused one year before, or so, the rock bottom ship prices, which we showed above (Figure 6). The rock bottom freight rates emerged in 1986, and also in Jan. 2015; below 2000 units, we had also the index from 1985 to 2003, from 2006 to 2009, and from 2011 to 2016… In all these periods ship prices are affected downwards and this justifies Mr. Procopiou saying above “buy now and buy cheap” in 2016.
We turn now to shipbuilding prices.
As shown, the global shipbuilding prices followed the course of freight markets for both the 85,000-dwt tanker and the 30,000-dwt bulk carrier. The perfect
![]() Source: modified from Stopford (2009), p. 630.
Source: modified from Stopford (2009), p. 630.
Figure 8. Global shipbuilding prices, 1964-2007.
timing to build a tanker is: 1st best: at $8 - $10 m (1964-1969); 2nd best: at $15 - $17 m (1970-1972; 1975-1976); and at $17 m (1985). Best for selling her is in 1990 or 2007 at 54 m and 70 m respectively. Similarly, for the 30,000-dwt bulk carrier: 1st best at $5 m (1964-1969) to buy and 35m to sell (2007), passing frequently through prices of $15 m (Figure 8).
6. Part III: Spot or Time Charter?
This is a more difficult issue, than buying or building ships at the perfect timing, as it needs an increased foresight. We start with mentioning the differences between spot- and time-charter markets.
6.1. The Spot9 Market
The “spot” shipping market represents our day, or short-run, where a ship is engaged in one voyage to carry-out a specific cargo from port A to port B, for a fixed price per ton. This is why this is called also “voyage charter10”. To give an idea, this one voyage may last say 25 - 30 days on average (assuming 8,500 nautical miles at 10 n.m. speed per hour).
The main characteristics of the spot market are: 1) It is volatile, as it gets the immediate impacts of the balance between supply and demand, of wars, embargoes, canal closures etc. 2) At the side of demand is always purely competitive, because it is made-up of millions of small decisions taken by consumers, and grouped-out by sea importers/exporters. 3) If spot ships are not chartered, their services are lost, as ship services cannot be stored, while costs are running! Thus, this market has an urgent element and it may be called also a market in a “momentary equilibrium” (Stopford, 2009: p. 163). The more a market is volatile, the more is unpredictable.
The spot market creates a higher risk (and profit) for shipowners, as he/she has to accept the whatever freight rate is determined by Supply and Demand: very high or very low. This conforms with those arguing: “the more risk, the more profit”, but here we have to say also: “the more the risk, the greater the loss”. At good times this market provides high (sky-rocket) and sudden profits (2007-8), and also rock-bottom rates and high losses, together with laid-up and scrapping consequences (1985; 2009-2020). Important for this market is that the total cost has to be managed by the shipowner including the crucial items11 of voyage costs, one of which is fuel oil (Figure 9)!
As shown, the oil prices started to fluctuate in 01/12/1973, reaching $56 from $24 (more than double). In 01/04/1980 increased to $127 and in 01/06/2008 to $167, from a steady price for 40 years i.e., in 1905-1945 at $20. In 01/01/2021 the price was $52. Given that in time-charters the cost of oil is paid by the charterer, the oil price interests both charterers and shipowners alike, for different reasons.
In 01/06/2008 the price was $167, as mentioned. This high oil price means that the shipowner by applying perfect timing has to avoid the spot market, where he has to pay the high and perhaps increasing fuel oil cost. In fact, the total operating cost has to be related to the freight rate, which was high in mid-2008 (Figure 7), but this was not due to the fact that the cost was higher
![]() Source: data from MacroTrends; inflation taken into account.
Source: data from MacroTrends; inflation taken into account.
Figure 9. Real Crude oil prices 1905 (29/04) to 2021 (01/01).
given higher oil prices. The freight rate does not follow the operating cost, but the operating cost has to be adjusted to follow the prevailing freight rate!
As we say, shipping is a cost-driven and not price-driven industry. It may sound strange, but there is a perfect cost timing, as well. As a result, operating cost, but also total cost, have to be highly flexible and the budget have to be digitalized in 3 versions: at high, medium and low freight market. These 3 computer programs, some call them plans, will be distinguished by the different % that cost should be reduced following the fall in freight rates (20%? 60%?).
We reckon that a continuous adjustment program of budgeted cost will be better, than a step-by-step one (proposed above), tied to the “freight rate index” of the company. After advancing our above ideas, we discovered a full support of them in Jennings & Wattam (1998: pp. 242-244) in the slogan: “flexing the budget”.
Our experience taught us that the fall in income is multiple than the required fall in cost! So, cost should fall more than income. The budget programs will be automatic, and thus objective, tied to market, and Captains have to be fully aware of them. Perhaps shipping companies have to construct their own freight rate index instead of relying on Baltic for this, as cost and income differ among companies. This will also free managers to decide suddenly and perhaps unfairly to cut down say 20% of crew cost only when perhaps is rather too late.
If a crisis does not insist, the computer will permit a higher cost up to the one specifying the targeted net profit as put in the normal timing budget. Moreover, the reduced cost of all items in the budget of a good market, will indicate which items a manager has to or can reduce. The revised budget will be communicated to those handling the cost codes and those that approve expenses so that to be aware as to what they have to do.
To give an example, Technical department may postpone repairs, or even planned dry-dockings, in a communication with Class, which are welcome during a good market. Repairs and maintenance that may put the vessel and crew in danger surely cannot be postponed. The finance dept. manager may try to reduce interest cost or prolong loan repayments etc. The idea is to start cutting from big cost items and then coming down. As late Drucker said: “I can reduce any company’s costs by 20%, by paying a round visit in its office”!
6.2. The Time Charters
Time charters are distinguished in trip (one voyage) and in period (months or years). This market provides a stable income to shipowners, called apropos hire, and not freight, and thus a pre-known cost of transport to charterer and a pre known income for shipowner. If it is period time charter, it has the characteristic of a long-term economic relationship, which in the past lasted 15 - 20 years. As a result, this market expresses the long-run of economics.
This market has further advantages and disadvantages. Advantage for the shipowner is that the “time charter contract” can be used to obtain a loan through assignment of earnings to a bank. In case of a loan, a good time charter may serve the loan. As a result, it has been argued that shipowners having fixed financial obligations prefer the time charters.
The main disadvantages are: 1) A good time charter requires a sound and reliable charterer. Many charterers found it impossible to cover their obligations in the past (1981-1987 depression). 2) International inflation reduces the gap between hire and cost, and thus the net profit of the shipowner. Clever shipowners insert an adjustment clause of hire from year to year. 3) The Spot market may become so high, so that to make a shipowner to regret time chartering, and to try to cancel it or claim a rise. 4) The choice of time charter or spot depends on charterers, and not on shipowners.
Time charters in case of heavy uncertainty of the future developments are avoided, or they are done of shorter periods in a policy of “wait and see” by Charterers. Stopford (2009: p. 185) argued that the tankers in time charter between 1973 and 1987 varied from about 120 m dwt in 1977 (80%) to 20 m dwt in 1987, vis-à-vis 80 m dwt in 1977 and 120 m dwt in spot market in 1987. This perhaps was the result of the 1979 depression. In 2007, the tankers in time charter were about 50 m dwt and about 150 m dwt were in spot market! This reversal was due to the different policy12 applied mainly by Oil companies.Figure 10 and Figure 11 present the two markets of spot and time, over the same period, and for 4 sizes of ships.
The above rates show the same behavior, though the levels are different, due mainly to voyage costs included in spot ones. The perfect timing for a time charter is obviously in Jan. 1981 and in 1988. If a shipowner wished to avoid the
![]() Source: The Platou report, 1990, modified.
Source: The Platou report, 1990, modified.
Figure 10. Freight rates for bulk carriers.
![]() Source: The Platou report, 1990, modified.
Source: The Platou report, 1990, modified.
Figure 11. 12 Months’ T/C rates for bulk carriers.
decadence in 1982-1987 in the voyage market (spot), he/she had to turn to TC in March-1979-1980-and during the most part of 1981.
As shown, there is a difference between the 12-months’ time charters and freight rates. Taking e.g., the 30,000-dwt vessel, we see that her income is $38/ton (1980-81) or $1,140,000. Assuming that this particular voyage lasts 71 days13, she gets $16,056 per day. The TC is 12,000/day, this means that $4059/day account for the voyage costs (25%).
The whole analysis suggests that when freight rates are relatively high and their tendency is to increase, one has to stay in spot market. When the spot market tops and the tendency is to fall, one has to turn to time charter for as long as spot market rises to profitable levels. Do we ask a lot? Perhaps…
7. Part IV: Age and Size for Perfect Timing
We have now to determine the age and the size of ships, which we have decided to build or buy at a perfect time. Normally, larger vessels and younger ones are dearer. Though their prices are at rock bottom, the lower age and the greater size demand a premium, under normal circumstances. Figure 12 shows the newbuilding prices of 4 bulk carriers built in different times (different ages) and having different sizes, from 1978 to 1989.
As shown, the 115,000-dwt vessel, built in 1974, in 1980 valued $25.5 m, while the 65,000-dwt, built in 1972, valued $18 m, a difference of $7.5 m for a vessel of 2 years older and 40,000 dwt larger. The prices of these 4 sizes and ages, however, after 1983, converged-down towards one another, and for some of them were equal (for 35,000 dwt and 65,000 dwt ones). The 65,000-dwt vessel, built in 1982, claimed a higher price than the 115,000-dwt ship built in 1974, by almost $4 m,
![]() Source: modified from that in the Platou report, 1990.
Source: modified from that in the Platou report, 1990.
Figure 12. Market values of bulk carriers (estimated).
![]()
Table 3. Prices of ships of 4 different sizes and ages in 1/1978-1/1990 for selected years.
Source: Figure 12.
in 1987! In 1989 after the depression period 1981-1987 prices restored and their original differences came back, and they were as follows (Table 3).
As shown, all ship prices fell, due to the 1981-1987 depression, in 1986, depending on their individual supply and demand, based on their different age and size. Thus, 1986 provided a perfect timing to buy, and sell in 1990.
The impact of age on price is clear in the 2 ships of the same size (of 65,000 dwt), as the older was cheaper in 1990 by $10.5 m, showing a fall in price of almost $1 m per year of extra age. As far as sizes are concerned, the 115,000-dwt vessel was $6 m dearer than the 65,000-dwt, in 1990 (+75%) (having 2 years difference in age, meaning $2 m extra). The per dwt cost of capital in the 65,000-dwt ship was $123.1, while for the 115,000-dwt one, was $121.7; thus, we see economies of scale of $1.4 per ton ($161,000 benefit).
Let us see the differences in freight rates over types, ages and sizes in 2005 and 2006 (Table 4).
As shown, the younger ships cost more by $22 m in the 300,000-dwt ship and $8.5 m for 45,000-dwt tanker, in 2006. The 300,000-dwt 5-years old vessel obtained $22 m in 5 years or $4.4 m per year vis-à-vis her sister of 10-years old. This difference falls to $11 m for the 150,000-dwt or $2.2 m p.a., and so on. This
![]()
Table 4. Daily earnings of ships: tankers and dry cargoes of different size and age, 2006-2007.
Source: as in Figure 13.
![]() Source: data from “Kathimerini” weekly newspaper, 04/02/2007.
Source: data from “Kathimerini” weekly newspaper, 04/02/2007.
Figure 13. Values of ships of 5 and 10 years of age, tankers 2006-2007, 35,000 - 300,000 dwt.
analysis helps shipowners, we believe, to know for their main sizes (5 in above Figure 13) of tankers and dry cargoes ships to add a few million $ for each year by which their age is reduced. E.g., the 25,000 - 30,000-dwt dry cargo rose her prices from $23 m to $28.5 m in 2006 or $1.1 m p.a. by cutting 5 years from their age.
Colocotronis case-study is very pedagogical for a bad-timing. The firm established by Greek shipowner Minos C., which underwent an exceptional growth based on cash-flow financing. Nothing wrong with this. Colocotronis followed the common shipping practice buying relatively cheap vessels chartered them on period charters, and obtaining banking funds using ship mortgages and assignment of earnings. But Colocotronis committed a huge error in ordering in Dec. 1972 2 ULCCs priced $100 m-when the tanker market crashed 4 years later, in 1976!
Colocotronis accused (Stokes, 1997: pp. 43-44) of not using the “back-to-back” method14 as other shipowners did (e.g., the late Sir Yue-Kong Pao). Clever shipowners indeed secure their new-buildings with time charters for as long as possible, from the time of delivery! Apropos a perfect timing!
Couper (1999: p. 37), with others, argued that the Colocotronis’ collapse in 1975, demonstrated the effect which a substantial liability can cause to shipping companies, created by a large shipping investment -which subsequently turned-out to be ill-timed. Colocotronis ordered 2 ULCCs in 1975 and his liquidity problems then arose. These ships are between 320,000 and 500,000 dwt. Thus, this order amounted to about 640,000 dwt, meaning more than 21% of company’s total fleet. The company obtained a syndicated finance of $320 m, considered to be high.
Sanko with 1000 billion Yen debt has also collapsed in 1985 by ordering 125 handy-sized bulk carriers (3.75 m dwt) by interpreting wrongly the start and the end of shipping cycles.
As mentioned, Greeks, traditionally, avoided the new-buildings mainly because they did not have the required funds and/or the credit, and their cheaper crews could repair them while travelling. They saw many shipowners to become bankrupt due to their shipbuilding programs! Onassis was the first to prove, (Goulielmos, 2021a, 2021b), that fast growth cannot be achieved by buying small ships from other shipowners by using own past profits, which were anyway inadequate! We may say that Onassis was right, but he was lucky to be backed by a continuous prosperous oil market since 1945 to 1974, using other people’s money (bank finance)!
8. Part V: The Perfect Timing to Make an IPO
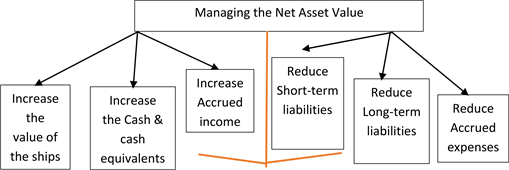
Despite of what is believed, also an IPO has its perfect timing! And this is when the “net asset value” of any shipping company, including the fictitious company PS, is at its top (Figure 14).
As shown, the best year (perfect timing) for an IPO was the period 2003-2005 and par excellence 2004! However, the crisis came later in end-2008! What shipping companies could do in such a case where the perfect timing to float was indeed in 2004, but they could not foresee global financial crisis 4 years later in end-2008? The answer is given by the following Graph 3.
As shown, the company has to increase the 3 positive items on the left-hand
![]() Source: data from Stopford (2009), p. 327.
Source: data from Stopford (2009), p. 327.
Figure 14. The NAVs of PS company, 1975-2005.
Source: author.
Graph 3. Managing the net asset value.
side and reduce the 3 negative factors on the right-hand side! An obvious way is to buy/build additional ships. First, we believe that any manager has to be familiar with company’s accounting! Secondly, we will present any company’s balance sheet classification.
The fixed assets i.e., the ships mainly, are those planned to be used for a long-term; this item includes also the office buildings, and other items. Current assets usually turn into cash in 12 months like: stocks, debtors and cash par excellence. Current liabilities are amounts payable to creditors due within 12-months (suppliers, important for shipping; tax payable, which is not important for shipping). Working capital is the difference between current assets and current liabilities. This is important though managers do not pay attention to it.
The “capital employed” is most important, which is divided between creditors (amounts due after 12 months; or long-term liabilities) and capital, as well reserves (shareholders’ funds or “share capital”). The creditors are created from company’s long-term (5 - 15 years) borrowing in the form of loans, mortgages (par excellence in shipping) or debentures. The accrued expenses are those expenses not yet paid, or invoiced (Reid & Myddelton, 2005: p. 5). Retained profits, accumulated, are, legally, allowed to become dividends, though companies use current profits.
Important statement in companies and banks, as well stock exchanges, is cash-flow. Some they say this to be the 3rd main financial statement in the annual accounts of companies. Its purpose is to show the amounts and the sources of cash received from all activities (operations, sales of ships, loans, IPO, etc.) and what happened to it (paying taxes, dividends, buying/building ships, repay loans, etc.).
If a manager wishes to increase company’s cash (absolute liquidity15), he/she has to increase first ships’ operating profits, then reduce stocks, debtors, interest, taxes, dividends, and buying/building ships… and depreciation! Moreover, we have to increase the capital issued (ordinary shares), to increase trade creditors and to borrow money! More cash is required in time of crisis like in end-2008, and thereafter till 2021, or obtain it from an IPO but in 2004. As argued by Couper (1999) with others “Tidal Marine” company collapsed in 1972 due to a severe cash-flow crisis within the firm (p. 36). Thus, shipping companies have to be prepared in order to float, and plan it, in advance by a strategy of tidying-out their accounts first.
9. Conclusion
The perfect timing of building ships and/or buying 2nd hand ones, is at rock bottom prices, and this happens, normally, soon after rock bottom freight rates. The level of the ship prices is the basis on which capital cost is based, and it takes the form of depreciation as well, which has to be covered by profits. Capital cost is the king in costs covering from 30% to 50% in 2nd hand and newly built ships. This has to be managed first. It provides competitiveness.
Capital cost includes the interest cost (financial expenses), and this cost may be even 25% of the borrowed amount at high interest rates and high loan amounts! Clever shipping companies try to build or buy ships at rock bottom prices and at rock bottom interest rates, if it is absolute necessary to borrow. But between rock bottom prices and rock bottom interest rates, companies should prefer the former, as the case may be, as shown above.
To be competitive, a shipping company has to minimize its borrowing and to prefer to buy 2nd hand ships relatively young, (say 5 years of age), vis-à-vis building a new one, as shown, without adopting an out-of-date technology. Our conclusions in favor of buying or building ships are at the exactly antipodes of selling them.
Larger ships and younger ones, under normal circumstances, demand higher prices, but larger ships provide economies of scale. One has to see if there are also economies of age. This means that age (lower) may reduce maintenance and insurance costs or even crew costs. It may add speed. It may attract the preference of charterers, especially if these are tankers. Thus, in a perfect timing concerning different costs, the one providing a higher benefit is chosen. This means to buy or build at rock bottom prices, no matter what interest rates prevail, as shown!
Greek shipowners, and not only them, despite their 1st global position in terms of tonnage, are unable for a number of actions: 1) to forecast shipping recessions and depressions; 2) to protect themselves from them; 3) to be in time-charters when hires are higher than spot freight rates; 4) to protect themselves from a fall in seaborne trade (demand); 5) to protect themselves from a massive over-ordering of ships; 6) to float at the perfect timing-year (2005); 7) to avoid, during Global Financial Crisis 2009-2019, to lose 2/3 of their capitalization of $14b. These are industry’s weak points, where science has been unable to help it so far!
Most Greek shipowners are good at: 1) building and buying ships at near rock bottom prices; 2) being aware of the importance that cost has, and thus to manage so that costs to be lower than those of their competitors, starting from big items like capital cost and drydocking one. They exhaust possibilities to reduce fuel cost; 3) the pioneers of them reduce financial costs, as much as possible, by borrowing at rock bottom interest rates or from Stock exchanges; 4) the pioneers of them organize also an effective computerized/digitalized simple and effective shore organization with few levels and personal management in a way of life; 5) the pioneers of them are aware of the economies of scale and the economies of age!
In all our analyses, we warned reader that economies of scale and larger vessels, are good things, provided there are cargoes for them out there available for their size! We fear that very big ships, when a crisis is on, the available unit loads may be also reduced, (as this happened in 1974, and especially in 1979, with the tankers VLCCs and ULCCs, who from launching were driven to scrapping yards!).
Especially building ships, whose prices are higher and their size larger, and building them aided by a substantial loan, and when during their 2 years, on average, of building time, market fell substantially, this will prove to be a fatal mistake. It is better to build a vessel at the uprising portion of the freight market, and if possible, to get delivery, at top freight rates or hires, than at the falling phase of the shipping cycle… These thoughts prove why timing is so important, because one untimely decision can destroy the whole company (case-study: the Colocotronis one).
As mentioned, ordering newly built ships at the top of the shipping cycle is not advisable, unless a time charter is secured. In such a case the problem is transferred from the shipowner to the charterer. Also, the shipowner has to ask himself/herself: “what if market collapses after delivery”? “Does my company have the liquidity to cover this obligation?” “Is this obligation so heavy that company cannot carry-it-out successfully in case something goes wrong”?
NOTES
1In a successful location (p. 104), or in new products (Gerber-baby foods), etc., and so that the timing-caring firm to be unique (p. 126).
2“Differentiation” of service in shipping was something unbelievable in the past based on homogeneity principle, till the age of the ships was incriminated of making ships vulnerable to marine accidents, even if ships are well maintained, especially tankers! Charterers today try to avoid hiring tankers over 15 years of age!
3Apart from being one out of the 7 factors for a company to be unique (p. 126).
4Authors stated 11 major decisions for manufacturers on: technology, scale, flexibility, location, finance & source of equipment, employees’ issues, production (4 issues) and materials.
5Cases of 1995 of Anheuser-Busch; Airbus & Boeing; Hewlett-Packard mentioned in Besanko et al. (2013), p. 235.
6The London interbank offer rate is a rate that is payable in London Eurodollar market for one bank to borrow from another. This means that LIBOR shows the cost (of money) for the bank. The spread thus is the profit of the bank from the deal. The 2% we used below, is rather high, and in reality, 0.75% - 1.5% is more usual. Shipping companies negotiate this spread to get it down as far as possible, while LIBOR is not negotiable. But clever shipping companies choose carefully the number of repayments, because if this is, say every 3 months, the 3-monthls LIBOR is used and it may be lower than the 6-months one used above. The frequent installments provide lower interest cost, no doubt, provided company has a proper cash-flow at that pace. The 3-months interest rate creates a cost of $10.73 m against $11.52 m the 6-monthly one and thus one saved $790,000…
7Interest is payable at the end of the repayment period and is calculated at a 360-days year, using the formula: Loan $ amount times interest rate in integer % times the number of days-T, divided by 36,000. Interest = L × T × IR/36,000 {2}.
8Through first preferred mortgage.
9A spot market in commodities is defined as the one in which goods are sold for immediate delivery.
10Though there are cases for a series of single voyages called consecutive voyages charter.
11In this cost, an important item is included: “bunker fuel cost”. We are all aware of the changes that oil prices have undergone in the past, and even in 2020-21 due to Pandemic. Certain periods this cost covered 1/3 of total operating cost! This cost in time charters is paid by Charterer, not the shipowner!
12In the past oil companies who chartered tankers from the so-called independents (private companies) induced them to build ships providing them with a long-term time charter. This increased supply and reduced hire!
13Houston-Tokyo is 16,995 n.m. assuming a speed of 10 n.m. per day, the days required are 71 not including port time.
14Here the lessor can structure the period and the rems of the lease precisely to match the revenues earned by the lessee on long-term contract.
15Accounting defines liquidity by including cash and marketable securities.