Thermal Modelling of a Remote Sensing Satellite Panel in an Inclined Orbit ()
1. Introduction
The paper introduces the thermal design and analysis of an equipment panel of a satellite in low earth inclined orbit. Solving of thermal budget equation numerically for the panel after changing MLI area by increasing or decreasing, depends on the amount of devices heat dissipation needed to be kept inside the satellite. Insulation decreases the amount of heat flux between two faces and avoids a great heat flux [1] [2]. Experimental, numerical study in addition to joined work is done with feasible statistics to measure MLI performance. Wesley [3] tested a number of MLI samples to reach the optimum coating density. However, the experimental result displays growth in coating density than the numerical calculations. It is as a result of the high proportion of radiation that is eluded in the model. Bapat et al. [4] showed an experimental study using unlike arrangements of spacer and specefic shield a comparison with numerical model. The result illustrates that the combination of aluminized Mylar and glass with specific thickness is perfect for MLI. Kangwen Sun et al. [5] developed a multilayer insulation material (MLI) first, and low temperature environment test is carried out to verify the insulation effect of MLI. Then, a thermal heat transfer model of flexible thin-film solar cell and MLI is proposed, and the equivalent thermal conductivity coefficients of flexible thin-film solar cell and Nomex honeycomb are calculated based on the environment test and the temperature profile of flexible thin-film solar cell versus each layer of MLI. Finally, FLUENT is used for modeling and simulation analysis on the flexible thin-film solar cell and MLI. Mavromatidis et al. [6] investigated the result of air spaces between the wall and MLI. MLI is perfect when located between two wooden walls keeping a minimum space. Alifanov et al. [7] considered the thermal conductance and emissivity by calculating the temperature and heat flux by the inverse problem method. Bapat et al. [8] performed a mathematical model to study the performance of MLI by using paired aluminized Mylar foil and glass fabric spacer with collective conduction, radiation and gas conduction. The gas conduction improved with growth in layer density because of the rise in actual thermal conductivity of the insulation.
2. Governing Equations
The thermal balance equation in transient case was solved by software tool called Thermal Desktop [9] [10] [11]. The energy balance terms, and the different sun fluxes are stated in Equation (1), and Figure 1 respectively.
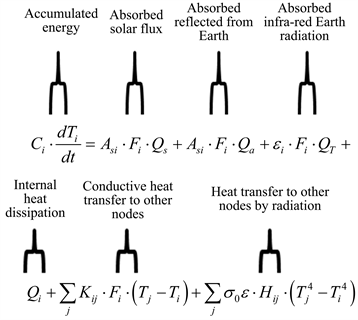 (1)
(1)
2.1. Radiator Area Calculations (Frad)
Radiator area calculations of the satellite panel which many devices fixed on and have heat dissipation are necessary to keep the heat balance between inside and outside the satellite.
By applying Thermal Budget Equation (Equation (1)) at maximum external solar fluxes, maximum heat dissipation, and after simplification as shown in (Equations (2), (3) [1] [12] [13], we can calculate the radiatior area which is suitable for our design.
(2)
(3)
2.2. Heaters Power Calculations (QHEATER)
Power consumption of heaters is calculated at the minimum values of external fluxes, and the minimum number of operating devices (minimum heat dissipation) as shown in (Equation (4)) [14], by using the calculated radiator area from Equation (2) to be able to compensate the heat losses inside satellite during Eclipse.
(4)
3. Numerical Validation
Numerical validation for a hexagonal prism MR SAT [15], with dimensions of about 65 cm × 55 cm × 47 cm and a mass of 42.4 kg. Steady state and transient analyses were performed for the thermal model, applying the parameters for both the hot and cold case. The compared results of the transient analyses are shown for the hot and cold cases over a period of four orbits in Figure 2, Figure 3, respectively. The two red lines in the figures depict the most constraining operational temperature range for the satellite electrical components; with an upper limit of 45˚C and a lower limit of 10˚C. There is good agreement between both results.
4. Numerical and Thermal Analysis
4.1. Computational Work
Thermal modeling of an equipment panel for a satellite in an inclined LEO, at 650 km altitude is performed by Thermal desktop/Fluint software, to introduce a numerical prediction of different environmental factors which effects on satellite performance [16] [17] [18]. This paper solves of thermal budget equation numerically for the panel after changing MLI area by increasing or decreasing, depends on the amount of devices heat dissipation needed to be kept inside the satellite [19] [20] [21] [22]. The thermal analysis is performed to study worst cases that saellite exposed to. Hot Case which is the sum of external heat fluxes (Sun, Earth albedo and Infrared (IR), Solar cells radiation) is maximum, otherwise in cold case is minimum as shown in Figure 1. Numerical investigation and thermal analysis results are illustrated in this research, the higher and lower temperatures of the inferior surface of the panel should be maintained in the specified temperature ranges from −10˚C up to +50˚C. Thermal analysis helps to recognize the amount of power of heaters consumed and its location on the panel as shown in Figure 4.
4.2. Boundary Conditions
The software tool solves the thermal budget equation Equation (1) in transient case when shooting mode is available, when sun is orthogonally to the panel radiation surface, so that the value of sun flux is maximum = 1423 W/m2. The normal temperature value of external radiation is 20˚С, as shown in Figure 5, Figure 6. Power consumption of heaters is calculated at the lowest values of external fluxes, and minimum number of operating devices (Eclipse), which it should not totally exceeded than 30 W till Satellite exits from shadow zone.
Figure 5 shows the total absorbed flux w.r.to time for all nodes on the panel in nominal mode.
Figure 6 shows the total absorbed flux w.r.to time for all nodes on the panel in shooting mode, the total fluxes are maximum in shooting mode which all devices fixed on the panel are operating, and sun is orthogonally to the panel.
Figure 7 shows the satellite real revolution with both heat fluxes in nominal mode, and shooting mode, and their relation w.r.to time.
![]()
Figure 5. Total absorbed fluxes w.r.to time for all nodes on the panel in nominal mode.
![]()
Figure 6. Total absorbed fluxes w.r.to time for all nodes on the panel in shooting mode.
![]()
Figure 7. Heat fluxes in shooting mode, and nominal mode w.r.to time during one revolution.
4.3. Case Studies
4.3.1. Case Study 1
Thermal modeling for an equipment panel with no MLI layers covered the outer surface are created as following:
- Draw the equipment panel with of Upper and Lower Sheets (Figure 8).
- Draw the heat pipes alongside the panel (Figure 9).
- Insertion of heaters and temperature sensors at specified points (Figure 10)
- Assign heat loads on each device on the panel in (Figure 11).
- Performing thermal analysis for two cases (Hot and Cold) at beta angle (angle between the orbital plane and the vector to the sun) β = −60˚, 0˚ respectively (Figure 12, Figure 13). The cold case has 10 nominal orbits, and The hot case has 20 orbits (Table 1, Table 2).
4.3.2. Case Study 2
Thermal modeling for a panel by MLI layers covered the outer surface are created by similar sequences as in case 1, then draw MLI layers on the outer surface of the panel, as shown in Figure 14, Figure 15.
5. Results and Discussions
5.1. Case Study 1 Results
The achieved results are shown as in Figures 16-19.
Figure 16 shows the temperature values w.r.to time for all nodes on the interior surface of the panel during the mission (hot case), The maximum temperature is not more than 30˚C (5˚C fewer than the highest temperature of acceptable value), which is good.
Figure 17 shows the temperature values w.r.to time for all nodes on the interior surface of the panel during nominal mode (cold case). The maximum temperature is not more than 30˚C (5˚C fewer than the highest temperature of acceptable value), which is good.
Figure 18 shows number of on/off heaters cycling during the mission, because it reflects the temperature stability on the internal surface of the panel. The value of the total power consumption of the panel heaters would not be more than 20 - 30 w.
Figure 19 shows the temperature values on the panel internal surface through mission.
5.2. Case Study 1 Discussions
The results shown below in Table 3 seem like need some more corrections owing to the following:
- The maximum temperature should be 30˚C (5˚C fewer than the highest temperature of acceptable value).
- The panel total heaters power consumption of should not be higher than 20 - 30 w.
So that, to have sensibleand significant values, related to the earlier flow chart, it is required to increase MLI layers on the panel outer surface to reach the following:
- Rise maximum temperature on the panel till 30˚C by decreasing the surface area of radiation.
- Reduction of the heaters power consumption.
![]()
Figure 16. Temperature Values Distribution on the interior surface (Hot Case).
![]()
Figure 17. Temperature values Distribution on the interior surface (Cold Case).
![]()
Figure 18. Heaters ON/OFF cycling (Cold Case).
![]()
Figure 20. Temperature values on the internal surface of the panel (Hot Case).
![]()
Figure 21. Temperature Contours on the internal surface of the panel (Hot Case).
5.3. Case Study 2 Results and Discussions
The following results as shown in figures 20 and 21 after increasing MLI layers, are representing the temperature distributions on the internal surface of the panel:
Figure 20 shows the temperature values w.r.to time for all nodes on the interior surface of the panel during the mission (hot case), The maximum temperature is not more than 30˚C (5˚C fewer than the highest temperature of acceptable value), which is good.
Figure 21 shows the Temperature Contours on the internal surface of the panel, the maximum temperature in shooting mode is 27˚C in shooting mode, and the minimum temperature is 4˚C in nominal modewhich is still good.
The results in conclusion reached are in Table 4 as follows:
Finally, the maximum temperature is fewer than 30˚C but the total value of the power consumption still higher than 30 W, so it is required to change the heaters de-activation and activation temperature settings to minimize their value of power consumption.
6. Conclusions
The followings are the main conclusions in this paper:
- Thermal Desktop Software is a perfect tool to produce satellite thermal design and analysis, and estimate temperature values, radiators area, and heaters power consumption for the panel.
- The maximum temperature is 27˚C which is ideal (5˚C lower than the highest limit of acceptable temperature ranges).
- Heaters power consumption for the main and reserve groups is in normal values.
- Heaters power consumption total value is 57 W, which is higher than the acceptable; however in that case it is necessary to change temperature settings for the heaters de-activation and activation to minimize their power consumption.
- Finally, the thermal model ensures the design requirements, and guaranteed the performance of the satellite thermally during its lifetime.
Nomenclature
Abbreviations