Effects of Forest Resources on the Reception of Foreign Direct Investment in Congo Basin Countries ()
1. Introduction
The exploitation of natural resources in general and forestry resources in particular are the main motives for foreign direct investment in developing countries. These countries are characterized by insufficient domestic savings on the one hand and confronted with the imperatives of sustainable development on the other, and the countries of the Congo Basin1 are hardly an exception. Indeed, this area, which is home to the second largest tropical forest in the world in terms of surface area (approximately 3 million km2) after the Amazon (approximately 7.7 million km2), is the subject of particular attention from the international community, all the more so because it contributes to the mitigation of greenhouse gas emissions, which are the cause of climate change.
These countries have faced a significant influx of foreign direct investment in recent years, attracted, among other things, by the importance of forest cover and species in the area. By way of illustration, FDI inflows have increased from 5 billion dollars in 2013 to approximately 7.6 billion dollars in 2018, and these have concentrated in two countries: Congo, 4.3 billion or 56.58%, and the Democratic Republic of Congo, 1.3 billion or 16.85% in 20182. At the same time, there has also been an annual loss of forest cover in the area of approximately 49883 km2 between 2015 and 2016. The Democratic Republic of Congo and Cameroon are in the lead for this metric, with losses of 3114 km2 and 2200 km2 respectively.
In the literature, the debate is approached from the perspective of the effects of natural resources on foreign direct investment. On the theoretical level, two opposing groups of theories exist: The first group includes international trade theories and accepts the positive effect of natural resources on FDI inflows. Thus, a country’s endowment in raw materials constitutes a specific advantage in mobilizing FDI based on a primary strategy ( Dunning, 1993). Similarly, FDI that emphasizes vertical and horizontal integration strategies are attracted to areas that are better endowed with natural resources ( Mucchielli, 1991).
The second group, by contrast, supports the negative effect of natural resources on FDI inflows. This group relies on the natural resource curse4 hypothesis, which explains this negative effect by: 1) the volatility of commodity prices (van der Ploeg, 2011; Moradbeigi & Law, 2016); 2) the presence of oligarchic, autocratic or dictatorial institutions (de Soysa, 2002; Fearon, 2005; Robinson, 2014; Kaldor et al., 2007; Botlhole et al., 2012; Wright et al., 2015; Caselli & Tesei, 2016; Wiig & Kolstad, 2010); 3) the existence of anarchic institutions with nonapplication of property rights (Beblawi, 1987; Karl, 2007; Auty, 2001; Ross, 2001); 4) the emergence of civil wars (Collier & Hoeffler, 2002; Ross, 2004; Collier et al., 2009); 5) the existence of Dutch disease (Corden & Neary, 1982; Krugman, 1987; Papyrakis & Gerlagh, 2004; Slaibi & Kyle, 2007); and 6) the absence of long-term planning (Humphreys et al., 2007).
On the empirical level, the studies carried out confirm the controversies noted on the theoretical level. Thus, Asiedu & Lien (2003) and Onyeiwu & Shrestha (2004) find in panel data from some African countries a positive relationship between natural resource endowments and FDI inflows. However, Poelhekke and van der Ploeg (2010, 2013) conclude from their study of selected African countries that natural resource endowments have a negative effect on FDI inflows overall. Taking into account these controversies, the objective of this paper is to analyze the effects of forest resources on the reception of FDI in the countries of the Congo Basin. Two reasons justify the choice of this area: the loss of forest cover in the zone, which raises questions about the regulatory role for the global climate played by this region along with the Amazon, and the imperatives of sustainable development centered essentially on the responsible exploitation of natural resources in general and forest resources in particular. In addition to the introductory section, the remainder of this work is structured in four sections: the second includes the literature review, the third section discusses methodology, the fourth presents and interprets the results, and the fifth section is devoted to the conclusion and policy implications.
2. Literature Review
Generally, the two groups of theories clash, and their conclusions are both theoretically and empirically contradictory. At the theoretical level, and with regard to the theories that support the positive effect of natural resources, we distinguish between the theory of production factor endowments (Heckscher, 1919; Ohlin, 1933; Samuelson, 1948), eclectic theory (Dunning, 1979, 1988), product life cycle theory (Vernon, 1966), the theory of firm internalization (Coase, 1988) and the theory of market imperfection (Krugman, 1991). These theories highlight the existence of a country-specific advantage resulting from factor endowments. Thus, in the particular case of the product life cycle, the relocation of firms during the maturity phase generates FDI motivated by the control of raw materials; the challenge for the leading firm is to maintain its technological lead. Similarly, the theory of internalization shows that it is advantageous for a firm to have control over its sources of supply for raw materials. This advantage will result in the deployment of firms to countries endowed with natural resources.
The second group of theories supports the negative effect of natural resource endowments based on the hypothesis of the curse of natural resources (Collier & Hoeffler, 1998; Auty, 2001; Gylfason & Zoega, 2006; Asiedu & Lien, 2011). These authors highlight two factors: the crowding out effect of FDI from the natural resource sector and the political instability, corruption and low investment in physical and human capital generated by a country’s natural resource endowment. With respect to crowding out, increased FDI in the natural resource sector can, like Dutch disease, discourage investment in other sectors, which can lead to a net decline in FDI in the economy as a whole. With regard to the second factor, political instability and corruption generated by the exploitation of natural resources hamper investment in non-extractive sectors.
For the empirical review, the results obtained are mixed insofar as the controversies observed at the theoretical level are also noted. Thus, Morisset (2000), in an econometric study of 29 Sub-Saharan African countries for the period 1990-1997 using panel and cross-sectional data, finds that the availability of natural resources has a positive effect on FDI inflows, with elasticities of 0.92 and 1.2, respectively.
Noorbakhsh et al. (2001), Asiedu (2002, 2006), Onyeiwu and Shrestha (2004), Anyanwu (2012) and Jadhav (2012), in their respective studies, conclude that resource-rich countries receive more FDI than resource-poor countries, the majority of these resources being oriented towards the extractive sector.
Similar to Cleeve et al. (2015), Mensah and Asamoah (2015), in their studies of 35 and 49 Sub-Saharan African countries during the periods 1980-2012 and 1980-2011, respectively, conclude that there is a positive relationship between natural resources and FDI inflows.
However, Asiedu & Lien (2003), in a study of panel data from 22 African countries for the period 1984-2000, puts this conclusion into perspective by arguing that FDI inflows into Africa are not solely motivated by its natural resource endowment and condition the positive effect of natural resources on the existence of a stable macroeconomic framework, political stability, good infrastructure and an effective legal framework in the host country.
Soysa and Neumayer (2007), in their study on the effect of natural resources on FDI inflows in selected developing countries, conclude that natural resources captured by forestry, mining and oil rents have a negative effect on FDI inflows. The main explanation is that these natural resources are the origin of ethnic conflicts and civil wars that alter the stability of the business climate essential for attracting FDI flows directed towards the industrial and services sectors. In this vein, Asiedu (2013), in his work on selected Sub-Saharan African countries, finds a negative relationship between a country’s natural resources and its FDI inflows. The explanation she gives for this is the curse of natural resources, which generates an unstable environment less favorable to foreign direct investment.
These contradictory results for the nature of the effect of natural resources on FDI inflows lead us to deepen our reflection in the Congo Basin, which is subject to a double imperative: the sustainable development of member countries and ensuring, alongside the Amazon, the regulation of the global climate.
3. Methodology
This analysis is structured in six points: the theoretical framework and specification of the model, the presentation of the model variables, the nature of the panel and the spatial autocorrelation test, the stationarity and cointegration of the variables, the stylized facts and the descriptive statistics.
3.1. Theoretical Framework and Model Specification
The factors explaining FDI inflows in the literature fall into two broad categories: micro and macroeconomic factors. Generally, according to Kinda (2010), the decision to invest in a foreign country depends fundamentally on the expected return on investment or the profit expected from such investment. Profit (Π) is the difference between total revenue (TR) and total cost (TC). The functional form is:
, (1)
With TC = IC + OC + HC; dΠ/dP, dΠ/dQ > 0 et dΠ/dIC, dΠ/dOC, dΠ/dHC < 0.
P = output price (Q) determined by the market; TC = total cost; IC = input cost (cost of labor, land, raw materials, etc.);
OC= operating costs (financial costs, time costs, transaction and transportation costs); HC = hidden cost (difference between the time and money costs reported by the government and the time and money actually paid by the investor). The variables that determine profit also determine the inflow of FDI into a country; hence, the reduced form:
(2)
(3)
Taking into account the review of the literature, we retain the following explanatory variables: forest rent (FR), gross domestic product per capita (GDP_H), degree of openness (DO), FDI lagged by one period (FDI (−1)), corruption control (CC) and gross fixed capital formation (GFCF). The implicit form of the model is FDI = f (FR, GDP_H, DO, FDI (−1), CC, GFCF). The explicit formulation in panel data is as follows:
(4)
3.2. Presentation of Variables
We next distinguish the explained and the explanatory variables.
3.2.1. Explained Variable
FDI: Foreign direct investment. It represents net FDI inflows as a percentage of gross domestic product. It also captures the importance of foreign financial flows in relation to domestic production.
3.2.2. Explanatory Variables
A distinction is made between the variable of interest and the control variables.
1) Variable of interest
FR: Forest annuity. It represents the resources from logging activities. It is also expressed as a percentage of GDP. The expected sign is ambiguous (β1 < 0 or β2 > 0)
2) Control variables
GDP_H: Gross domestic product per capita. It reflects the purchasing power of the population and represents the size of the market. According to the literature, the expected sign is positive (β2 > 0);
DO: Degree of openness. It represents the degree of openness of the economy. It is the sum of exports and imports relative to GDP. It is expressed as a percentage. A high degree of openness attracts investors because they can easily import capital goods and sell their products. The expected sign of this variable is positive (β3 > 0);
FDI (−1): Foreign direct investment lagged one period. It reflects the influence that the previous year’s FDI has on the current year’s FDI. Indeed, the existence of FDI in a country reassures investors who wish to settle there by suggesting opportunities exist for partnerships, the exchange of information, etc. The expected sign of this variable is positive (β4 > 0);
CC: Control of corruption. It reflects the quality of governance in the host country. The more effective the control is, the greater the flow of inward FDI because it does not mix well with corruption. According to the literature, the expected sign is positive (β5 > 0), and εit is the error term;
GFCF: Gross fixed capital formation (as a percentage of GDP). This variable is taken into account to reflect the effects of complementarity between foreign and domestic capital. The expected sign is not determined a priori (β6 < 0 or β6 > 0).
3.3. Nature of the Panel and Spatial Autocorrelation Test
The use of panel data requires clarification on the nature (homogeneous or heterogeneous) of the panel and on whether the spatial dimension is taken into account in the analysis.
3.3.1. Nature of the Panel
Data exploration is performed in the first step, and in the second step, a statistical test is conducted.
1) Data mining
Data mining graphically assesses the nature of the panel on individual and temporal dimensions as shown in the two Figure 1 & Figure 2 below.
These Figures show that the confidence interval of average FDI inflows is variable in both dimensions. This double variability suggests possible heterogeneity in the Congo Basin.
![]() Source: Author, extracted from WDI World Bank (2019) data.
Source: Author, extracted from WDI World Bank (2019) data.
Figure 2. Temporal dimension.
2) Specification test
The results of the Hsiao (1986) test are summarized in Table 1 below.
![]()
Table 1. Test results for the Congo Basin.
Source: Author, based on results obtained from Stata 15.
The results of the test show that, with a 5% risk of error, the panel comprising the countries of the Congo Basin is partially homogeneous. Therefore, an individual effects model will be estimated.
3.3.2. Spatial Autocorrelation Test
This work concerns an area characterized by two types of proximity: geographical proximity (some countries share the same border) and institutional proximity (these countries are signatories to international agreements on sustainable forest management). In view of geographical proximity, it cannot be ruled out that for a company with activities in two neighboring countries, the level of investment in one country may be correlated with that of its neighbor. In such a case, it is reasonable to assume the existence of spatial dependence (spatial interaction) in a variable from one country to another. The use of a spatial model is subject to the existence of spatial autocorrelation in the dependent variable; spatial autocorrelation designating the absence of independence between neighboring observations. This lack of independence is stronger when the locations are closer (Tobler, 1970). The objective of the test is to evaluate the spatial dependence of FDI inflows into the Congo Basin. The results of the three tests are shown in Table 2 below.
![]()
Table 2. Spatial autocorrelation test results.
Source: Author, based on estimates from Stata 15.
The null hypothesis is the absence of spatial autocorrelation. The three indices and the P-values (less than 5%) reveal the existence of negative spatial autocorrelation in FDI inflows into the Congo Basin. A spatial model5 should be considered, but confirmation requires a test of non-nullity of the parameters ρ and/or λ carried out on the residuals of the stacked model obtained by the ordinary least squares method. The results of this test are summarized in Table 3 below.
Source: Author, based on estimates from Stata 15.
The results show that the null hypothesis (ρ = 0, λ = 0 reflecting the absence of spatial dependence of FDI inflows) is rejected because the P-values for the Lagrange robust multiplier test are lower than the 5% error risk. Therefore, the parameters ρ and λ are significantly different from zero. In this case, the spatial model to be estimated is the most robust model, the SDM (Elhorst, 2010; Le Gallo, 2004). Thus, the effect of forest resources on FDI inflows into the Congo Basin will be estimated by a spatial model, the SDM, whose vector form is:
(5)
y is the FDI inflows; x is the explanatory variables; μ represents individual effects; ε is the error term; ρ is the degree of dependence of a country’s FDI inflows on those of its neighbors; β is the estimators reflecting the effect of a country’s explanatory variables on its FDI inflows; θ is the estimators reflecting the effect of explanatory variables from neighboring countries on a country’s FDI inflows; and w is the weight matrix6 that captures the effect of space in explaining FDI inflows. Since individual effects can be fixed or random, the Hausman test is applied and yields the following results ( Table 4).
Source: Author, based on estimates from Stata 15.
Since the P-value is lower than the maximum risk of error (5%), the fixed-effects model is appropriate.
3.4. Stationarity and Cointegration of Variables
3.4.1. Stationarity
The results at the 5% threshold are summarized in Table 5 below.
![]()
Table 5. Results of the different tests.
Source: Author, based on estimates from Stata 15.
According to these results, the variables FDI, GDPH, DO and GFCF are stationary in first difference (integrated of order 1), and the variables FR and CC are stationary in level (integrated of order 0).
3.4.2. Cointegration
Because the panel is partially heterogeneous, we use the Pedroni (2001) test, which takes heterogeneity into account through parameters that may be different from one individual to another. The results of the test are as follows (Table 6).
These results show that the variables in the model have a long-term relationship in both dimensions because most of the statistics are significantly different from zero at the 1% threshold.
![]()
Table 6. Pedroni cointegration test results.
Source: Author, based on estimates from Stata 15.
3.5. Descriptive Statistics (Table 7)
![]()
Table 7. Descriptive statistics of the Congo Basin.
Source: Author, extracted from World Bank (WDI and WGI) and UNCTAD databases.
During the period under review (Table 7), FDI inflows into the Congo Basin represented on average 6.84% of the gross domestic product of the zone, with maximum and minimum values of 161.8% and −8.7%, respectively recorded in Equatorial Guinea and Gabon in 1996. There is high variability in these flows, estimated at 248.19%. The major investments made in Equatorial Guinea in the oil sector in 1996 and the effects of socio-political unrest following the democratic exercise in Gabon in the 1990s are the main explanations. In addition, inter- and intra-individual differences are on the order of 7.62% and 15.47%, respectively.
Forest rent represents, on average, 7.64% of the gross domestic product, with a minimum value of 0.33% recorded in Equatorial Guinea in 2011 and a maximum value of 33.8% recorded in the DRC in 1996. This configuration can be explained, as far as Equatorial Guinea is concerned, by the massive influx of FDI in the oil sector following the discovery of new deposits, which has led to the decline in FDI in the timber sector. For the DRC, this large share in forest rent is caused by the weakness of legal and regulatory mechanisms for logging. In addition, the control variables are more stable7 (low variability).
3.6. Stylized Facts
These facts relate to the evolution of FDI inflows and forest rent in the Congo Basin, as shown in Figure 3 & Figure 4 below.
![]() Source: Author, extracted from the World Bank’s WDI database.
Source: Author, extracted from the World Bank’s WDI database.
Figure 3. Evolution of average FDI inflows and forest rent in the Congo Basin (as a percentage of GDP).
![]() Source: Author, extracted from the World Bank’s WDI database
Source: Author, extracted from the World Bank’s WDI database
Figure 4. Evolution of FDI inflows and forest rent by country (as a percentage of GDP).
The evolution of FDI inflows and forest rent in the Congo Basin (Figure 3) can be analyzed by distinguishing two periods: the first (1980-1995) is marked by an upward trend in both variables that can be explained by the fact that the nature conservation system was still in its infancy. The second period (1995-2017), on the other hand, is characterized by a downward trend in FDI inflows, while the forest rent has a downward trend up to 2000 before evolving in a stable manner after 2000.
The commitments made by member countries with regard to forestry exploitation and the strengthening of the nature conservation system may be the main cause of this trend. Moreover, the peak observed in 1995 is due, as far as FDI inflows are concerned, to their increase in Equatorial Guinea; while that of forest rent originates in the increases recorded in Equatorial Guinea, DRC and Central Africa (Figure 4). In sum, these Figures highlight, both in the basin as a whole and in each country, a link between FDI inflows and forest rent.
4. Presentation and Interpretation of Results
The estimation of Durbin’s dynamic spatial model (SDM) by the maximum likelihood method gives the following results (Table 8).
4.1. Presentation of Results
![]()
![]()
Table 8. Estimation results for the three dynamic model options.
Source: Author, based on estimates from Stata 15. (***) significant at 1%, (**) significant at 5%, (*) significant at 10%. ET_CT, total short-term effect; ET_LT, total long-term effect.
These results show that the SDM2 model minimizes the loss of information because it has a smaller AIC. Therefore, our analysis is based on the results of this model. On the whole, the results are statistically satisfactory because more than 50% of the variability in FDI inflows into the Congo Basin is explained by the explanatory variables retained in general and by forest resources in particular. Moreover, the spatial interaction coefficient (ρ) of FDI inflows in this zone is positive and statistically significant at the 5% threshold. Forest resources also have a positive and significant effect at the 1% threshold on FDI inflows, and these effects are positive and significant in the short and long term. These results are consistent with those of Morisset (2000), Noorbakhsh et al (2001), Asiedu (2002), Onyeiwu and Shrestha (2004), Anyanwu (2012), Jadhav (2012), Cleeve et al (2015), Mensah and Asamoah (2015). Conversely, these results are not in line with those of Asiedu & Lien (2003), who condition this positive effect on the existence of a stable macroeconomic framework in the host country, or Soysa and Neumayer (2007) and Asiedu (2013), who find a negative effect of natural resources on FDI inflows.
4.2. Interpretation of Results
Two arguments can explain the attractiveness of the forest resources of the Congo Basin area to foreign direct investment: the state of forest governance characterized by noncompliance with the legal and regulatory provisions governing forest concessions and the embryonic level of the forestry industry.
With regard to the first argument, the state of forest governance, which can be understood as a product of the level of corruption in the area, plays a major role. In fact, a deterioration in the corruption control index (Kaufman et al., 2012) can be observed, as shown in Figure 5 below.
![]() Source: Author, extracted from World Bank WDI data.
Source: Author, extracted from World Bank WDI data.
Figure 5. Evolution of the corruption control index in the Congo Basin.
This Figureshows that for the area as a whole and during the period under review, the corruption control index is negative for all countries. Moreover, this index has been steadily deteriorating since 2011. The DRC, which has the largest forest cover in the zone, ranks last with Equatorial Guinea in terms of corruption control. This reflects the scale of governance problems in general and of forest governance in particular in the Congo Basin. Indeed, the extent of corruption in the forest administration of the various countries could be at the root of noncompliance with the provisions of the various forestry codes, in particular provision 85/158. Violation of this provision in most countries may explain the influx of FDI into the forestry sector, all the more so as companies operating in the sector, mostly of Asian origin, find an opportunity to export their products to international markets considered more remunerative.
For the second argument relating to the embryonic level of the forestry industry, this is reflected in the massive export of logs, the essential consequences of which are the decrease in forest cover and the increase in greenhouse9 gas emissions, as seen in Figure 6 & Figure 7 below.
![]() Source: Author, extracted from World Bank WDI data.
Source: Author, extracted from World Bank WDI data.
Figure 6. Evolution of forest cover (in sq. km).
![]() Source: Author, extracted from World Bank WDI data.
Source: Author, extracted from World Bank WDI data.
Figure 7. Evolution of CO2 emissions (in kt).
These two Figures highlight the effects of the intense forestry sector activity in the Congo Basin from 1996 to 2014. The embryonic nature of the forest industry means that the bulk of production is exported. The influx of FDI in this sector is partly responsible for deforestation, the salient manifestations of which are the decrease in forest cover and the increase in CO2 emissions. Thus, there was a downward trend in forest cover in the Congo Basin during the period under review. CO2 emissions, with the exception of a drop during the 1996-2000 and 2004-2006 periods, have been increasing continuously since 2001. If these trends continue, it raises questions about the capacity of the Congo Basin to ensure its role as a regulator of the global climate alongside the Amazon.
5. Conclusion and Policy Implications
Sustainable development and the mobilization of external capital remain the leitmotif of all economic policy actions in developing countries characterized by low domestic savings. Thus, and particularly for African countries endowed with natural resources, strategies (such as the adoption of attractive mining and forestry codes) have been implemented with a view to attracting external financing in general and FDI in particular. The objective of this paper is to analyze the effects of forest resources on the reception of foreign direct investment in the countries of the Congo Basin.
The panel data used cover the period 1996-2018 and are extracted from the World Bank’s WDI and WGI databases. The spatial autocorrelation of FDI inflows into the Congo Basin leads to the use of a spatial dynamic Durbin model (SDM). The results of the estimation of this model by the maximum likelihood method show that forest resources have a significant positive effect on FDI inflows and that the spillover effects of inflows from the neighborhood (ρ) are also positive and significant. These results imply a need for 1) the generalization of logging in forest concessions while encouraging their certification and 2) the subregional harmonization of a repressive mechanism in cases where the legal and regulatory texts regarding logging are violated. The limit of this work is the exogeneity of the weight matrix. Thus, the use of an endogenous weight matrix is an avenue to be explored later.
Appendices
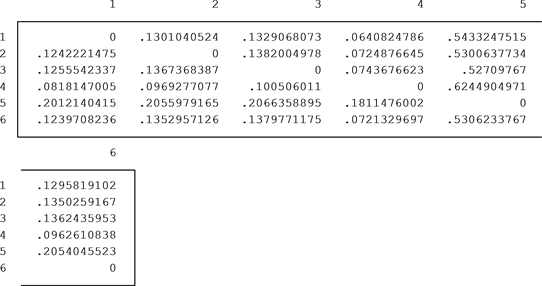
A1. Weight Matrix Used
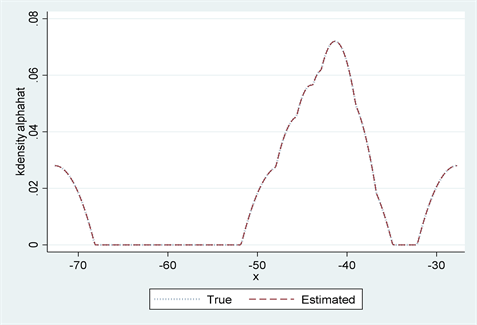
A2. Post Estimation
NOTES
1These are mainly the countries that are geographically part of the Congo Basin (Cameroon, Central African Republic, Congo, Gabon, Equatorial Guinea and the Democratic Republic of Congo).
2Author’s calculations based on data extracted from WDI and UNCTAD (2019).
3Author’s calculations based on data extracted from WDI.
4 Auty and Warhurst (1993) define the natural resource curse, or paradox of abundance, as the perverse effects of a country’s natural resource wealth on its economic, social or political well-being.
5The main models in vector form are: the spatial Durbin model SDM (
), the spatial error model SEM (
); the spatial autoregressive model SAR (
);
measure the degree of dependence of the variable, and w the weight matrix used.
6The proximity taken into account here is the importance of the forest cover of two countries in the entire Congo Basin. Thus, the elements of this matrix represent the inverse of the importance of the forest cover of the two countries, except for the main diagonal, which by convention is nil.
7Indeed, these variables have a coefficient of variation of less than 100% with the exception of the GDPH.
8This is a provision obliging operators, in the case of wood exploitation, to locally process at least 85% of their production and to export no more than 15%.
9In particular carbon dioxide (CO2).