Dimension Reduction for Detecting a Difference in Two High-Dimensional Mean Vectors ()
1. Introduction
When considering two multivariate-normal populations, researchers often attempt to determine if a difference exists between population-mean vectors. Traditionally, Hotelling’s T2 test has been utilized to determine if a difference exists. However, this test can be applied only when the data has a combined sample size that is greater than the original feature dimension because Hotelling’s T2 test depends on the non-singularity of the sample covariance matrix. When the sample-data dimension is greater than the sum of the sample sizes, we say the data is “high-dimensional”. For a fixed sample size, increasing the data dimension increases the covariance-matrix estimator variability, thus yielding statistical hypothesis tests for the difference in two population-mean vectors that are less powerful. Also, if the data dimension is greater than the sum of the group sample sizes, then the corresponding pooled-sample covariance matrix is singular and, therefore, one cannot conduct Hotelling’s T2 test for a mean difference. Hence, alternative tests for detecting the difference of two high-dimensional mean vectors, data dimension reduction (DR), or alternative tests combined with DR must be utilized.
In this paper, we investigate the efficacy of linear DR via the singular value decomposition (SVD) applied to a concatonated data matrix. Specifically, we examine the change in test powers for five tests for the difference of two high-dimensional mean vectors after implementing our DR to the original data. When applicable, we also apply the traditional Hotelling’s T2 test to the dimension-reduced data. Thus, using Monte Carlo power simulation studies, we contrast the powers of five high-dimensional tests with and without our proposed SVD-DR method. We concluded that SVD-DR, when applied to the data prior to conducting a test proposed by Thulin [1], yielded the largest omnibus power of the five considered tests whose empirical powers are contrasted here.
Throughout the paper, we use the notation
and
to represent the matrix space of all
and
matrices, respectively, over the real field
. Also, we let
represent the cone of all
nonnegative-definite real matrices, and we let
represent the cone interior of positive-definite matrices. Additionally,
represents the trace of the matrix
, and
denotes the Euclidean distance between the vectors
. We assume that the data of the form
with
and
, are randomly sampled from two distinct p-dimensional normal distributions denoted by
,
, where the corresponding population-mean vectors and common population covariance matrix are denoted by
, where
, and
, respectively.
For
, the ith sample mean vectors and sample covariance matrices are given by
and
respectively. An unbiased estimator of
is
(1)
The hypothesis test of interest is
Provided
, Hotelling’s T2 statistic is
(2)
where
If
, then (2) is incalculable.
Because of the increasing availability of high-dimensional data, especially in biological applications, researchers have proposed tests for the high-dimensional two-mean-vector problem. Dempster [2] first proposed a test for normally-distributed observation vectors where
. The high-dimensional problem for contrasting two population mean vectors has been explored in the literature in such articles as Bai and Saranadasa [3], who proposed a test with the same asymptotic power as the test proposed by Dempster [2] but without relying on the assumption of normality.
Also, Srivastava [4] proposed a test similar to Hotelling’s T2 test where the inverse of (1) was replaced by its corresponding Moore-Penrose inverse. In addition, Srivastava and Du [5] have proposed replacing (1) with
in (2), which results in a test statistic that is invariant under the group of non-singular
diagonal matrices. Park and Ayyala [6] and Chen and Quin [7] have also proposed test statistics for two high-dimensional population-mean vectors that do not rely on the assumption of equal covariance matrices, but these tests lose all information in the correlations between variables. Bickel and Levina [8] and Cai and Liu [9] have proposed tests using sparse estimators of the common covariance structure. In addition, Feng et al. [10] and Chen et al. [11] have proposed regularized versions of Hotelling’s T2 test. Moreover, Thulin [1] has proposed a modification to the test from Lopes et al. [12] by using random subspaces to improve test-statistic invariance properties. Zhang and Pan [13] followed the work of Thulin [1] by proposing a test using hierarchical clustering that more efficiently employs the covariance structure information in high dimensions. Srivastava et al. [14], He et al. [15], and others have also proposed tests for a difference in two high-dimensional population-mean vectors.
We have organized the remaining sections of the paper as follows. In Section 2, we present each of the five high-dimensional tests used to determine the utility of our proposed SVD-DR method. In Section 3, we present our SVD-DR approach, and in Section 4, we contrast the estimated power curves of each of the five considered tests using Monte Carlo simulations. Each test with and without SVD-DR is then applied to a bowel disease data set in Section 5. We then discuss the computational benefits of our proposed SVD-DR method in Section 6 and conclude with a brief discussion in Section 7.
2. Five Two-Sample Tests for a Difference between Two High-Dimensional Mean Vectors from Populations with Equal Covariance Matrices
We next describe five hypothesis tests for identifying differences in two high-dimensional mean vectors. Namely, we consider the tests derived in Bai and Saranadasa [3], Srivastava [4], Srivastava and Du [5], Thulin [1], and Zhang and Pan [13].
2.1. The Bai-Saranadasa Test
Dempster’s test for
when
under the assumption of equal population covariance matrices is
(3)
Let
. Under specified conditions, Bai and Saranadasa [3] proposed an asymptotic-based version of (3) given by
2.2. Srivastava’s T+2 Test
Srivastava [4] presented a test similar to (2) in which
is replaced by the Moore-Penrose inverse
because
. His test statistic is
2.3. The Srivastava-Du Test
The tests given by Bai and Saranadasa [3] and Srivastava [4] are invariant under transformations of the type
, provided
and
. However, these tests are not transformation-invariant for
non-singular, diagonal matrices. This fact implies that a change in units of measurement will affect the powers of both tests. To rectify this impediment, Srivastava and Du [5] proposed an invariant test statistic under
non-singular, diagonal matrices, which is
where
,
,
,
, and
, as
.
2.4. Thulin’s Random-Subspaces Test
Lopes et al. [12] also presented a test for identifying a difference between two high-dimensional mean vectors that use random projections of the data onto k-dimensional subspaces, where k is a sufficiently small positive integer. However, this test is not invariant under a linear transformation of the marginal distributions.
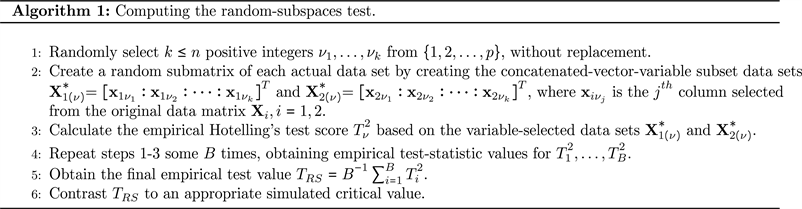
Moreover, Thulin [1] proposed a modification to the test by Lopes et al. [12] that uses random subspaces in lieu of random pseudo-projections and is invariant under linear transformations of the marginal distributions. We can use Algorithm 1 to compute the random-subspaces test presented by Thulin [1]. In the algorithm pseudo-code, we use the fact that
and
are the original-data matrices whose rows are composed of randomly sampled vectors of observations from their respective multivariate normal distributions.
The choice of the number of subspaces, k, directly affects the power of the random-subspaces test. If k is too small, much of the information contained in the multivariate structure is lost. However, if k is too large, test power is lost. For the random-subspaces test, Thulin [1] numerically verified that a good choice for k is
, where
is the “floor” function. Also, let B represent the number of randomly-selected subspaces. Thulin [1] showed that the random-subspaces test is essentially stable for
. Algorithm 1 describes the steps needed to perform the random-subspaces test.
2.5. Zhang and Pan’s Clustered Subspaces Test
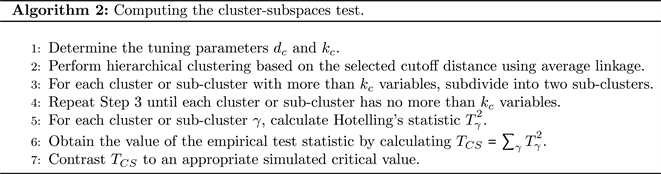
Zhang and Pan [13] followed the work of Thulin [1] and made more efficient use of the information in (1) by proposing a test using hierarchical clustering in lieu of random subspaces. In particular, highly-correlated variables are clustered together to create subspaces. Hotelling’s T2 statistic is then applied to each clustered subspace.
Clusters are initially calculated based on a cutoff distance
. For their power-study simulations, Zhang and Pan [13] used the tuning parameter value
, where
,
,
, and
is the standard normal cumulative distribution function. After one performs clustering on the variables, some clusters may contain an excessive number of variables. If a cluster contains more than
variables, we partition the cluster into two sub-clusters. This partitioning process continues until each cluster or sub-cluster contains no more than
variables. One can use Algorithm 2 to compute the clustered subspaces test presented in Zhang and Pan [13].
3. Linear Dimension Reduction via the SVD of a Concatonated Matrix of Two High-Dimensional Data Sets
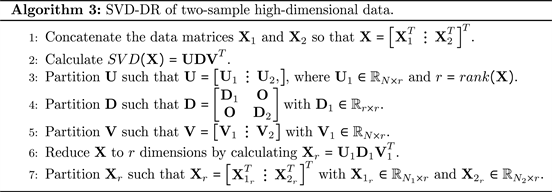
Below, we describe how we apply the SVD to a concatenated data matrix composed of the two sample-data sets to reduce the original data dimension. Through the deletion of a subset of right and left singular vectors associated with the SVD of the total data matrix, we eliminate information concerning the mean difference, which is of minor importance, while maintaining the bulk of the information for detecting that
. Thus, to reduce the dimensionality of the two considered datasets, we propose the following DR method. First, we horizontally concatenate the two data matrices,
and
, to form the
data matrix
and calculate
. Next, given r, where
, we determine
and subsequently eliminate the (
) columns of the left and right eigenvector matrices associated with the smallest (
) eigenvalues of
. This process yields an (
) approximation of
. Below in Algorithm 3, we present steps for calculating the SVD-DR method.
4. A Monte Carlo Power Contrast of Five Tests for High-Dimensional Means with and without DR
To examine the powers of the five considered tests for a difference between two high-dimensional population-mean vectors before and after applying DR on the concatenated data matrix
, we simulated the powers of the five two-sample-mean tests over varying values of
. Below, we describe the Monte Carlo simulation design that we used to examine the efficacy of the SVD-DR method.
4.1. Empirical Power Calculations
For our power simulations, we simulated critical values to compute the empirical power for each of the five considered tests for a difference between two high-dimensional population means. More specifically, we simulated
replications of the data under H0 and applied SVD-DR to each simulated data matrix. The
largest value of the empirical test values was selected as the critical value,
. We then generated another
replication of the data under H1 and applied our SVD-DR approach to each of the simulated data sets. The empirical power was then calculated by
where
represents the empirical test values generated under H1. We used
, which corresponded to the number of simulation iterations incorporated for power simulations by both Thulin [1] and Zhang and Pan [13].
4.2. The Monte Carlo Power Simulation Design
For the power-contrast study to evaluate the efficacy of the SVD-DR method, we utilized a Monte Carlo configuration similar to that used by Thulin [1] and Zhang and Pan [13] to generate simulated data sets. We generated
observations of the form
from
,
. We also let
,
, and
, where
, with
where
and
is the “ceiling” function. That is, we shifted 20 of 25 variable means in m of the p/25 subvectors. Also, we let
, where
, and
Therefore,
denotes a covariance matrix with unit variances and p/25 equal-sized non-diagonal submatrices. The off-diagonal covariance elements in each submatrix are equal to r if r and s belong to the same submatrix block and equal to s, otherwise. Here, we consider the covariance structures
, and
. For the Monte Carlo power simulations in Section 4.2, we used
and
.
4.3. The Monte Carlo Power-Simulation Results
In Figure 1 and Figure 3, we display power plots for each of the considered tests corresponding to each parameter configuration for which we have applied SVD-DR prior to conducting the tests. From the results shown in Figure 1, where all covariance matrices are diagonal, we observed that four of the five tests produced similar power curves. In particular, the test from Bai and Saranadasa [3] yielded the predominant power curve, and the test proposed by Srivastava [4]
![]()
Figure 1. Power curves of the five tests for mean differences with post-SVD-DR data when
,
and
with diagonal covariance matrices.
![]()
Figure 2. Power-difference plots of the five tests for mean differences conducted with post-SVD-DR data for
,
and
with diagonal covariance matrices.
![]()
Figure 3. Power curves of the five tests for mean differences conducted with post-SVD-DR data when
,
and
with non-diagonal covariance matrices.
invariably produced the least-prominent power curve. All five high-dimensional tests for a difference between two mean vectors contrasted here yielded increased power as m increased. Also, when the common covariance matrix was diagonal, we found that performing Hotelling’s T2 test on the SVD-DR data yielded powers comparable to those of the competing tests for two high-dimensional population means using post-SVD-DR data.
In Figure 2, we displayed power-difference plots for six parameter configurations with diagonal common covariance structures. For each test, the plots illustrate differences among the power curves using SVD-DR data minus the power curves using the original unreduced data. As shown in Figure 2, the tests by Bai and Saranadasa [3], Srivastava and Du [5], and the random subspaces test by Thulin [1] yielded a slight to moderate power increase when
. In contrast, the test proposed by Zhang and Pan [13] produced slightly increased power and the test by Srivastava [4] actually yielded decreased power for some values of
.
In Figure 3, we display power curves for the five tests conducted on SVD-DR data for six parameter configurations with non-diagonal covariance structures. We see that Thulin’s random-subspaces test, when applied to the SVD-DR data, yielded the best omnibus power curve for all six parameter configurations considered here. For most parameter configurations shown in Figure 3, Hotelling’s T2 test, conducted with SVD-DR data, yielded power curves similar to those of the random subspaces test by Thulin [1] across all mean and covariance matrix configurations with non-diagonal covariance structures. As within-block correlation and m increased, the test by Bai and Saranadasa [3] and the cluster-subspaces test of Srivastava and Du [5] generally provided the two smallest power curves.
More importantly, we contrasted the powers of each test for the difference between two high-dimensional mean vectors with and without the application of the SVD-DR to the original data in Figure 4. The plots display the power of each test with the SVD-DR data minus the corresponding test power without the SVD-DR method applied to the full-dimensional data. That is, the graphed plots represent the average power-difference for the powers before and after applying SVD-DR on the
data sets for each of the five tests for a difference between two high-dimensional population-mean vectors.
In each of the power-difference plots in Figure 4, we observed moderate to large increased test power for the random subspaces test proposed by Thulin [1] for all six parameter configurations. Specifically, Thulin’s [1] random subspaces test showed substantial maximal gains in power that ranged between 0.20 and 0.70, depending on
and on the type of population covariance structure. The tests given in Bai and Saranadasa [3] and Srivastava [4] yielded moderate power gains in three of the six parameter configurations. However, the clustered-random-subspaces test by Zhang and Pan [13] produced little increase in power and some decreased power in five of the six parameter configurations. The most significant result from Figure 4 was that SVD-DR consistantly and substantially improved the power of the random subspaces test by Thulin [1], which was already the most powerful considered test on the unreduced data. In addition, we see that when
is relatively large, the degree of power improvement is considerably lessened because the tests considered already have large power.
5. A Contrast of Test Performance with and without SVD-DR for Bowel Disease Data
Burczynski et al. [16] studied patients with two common inflammatory bowel
![]()
Figure 4. Power-difference plots of the five tests for mean differences conducted with post-SVD-DR for
,
and
with non-diagonal covariance matrices.
diseases that produce intestinal inflammation and cause tissue damage: Crohn’s disease and ulcerative colitis. For patients with inflammatory bowel disease, approximately 10% were diagnosed with diseases that were medically classified as indeterminate following a colonoscopy even though these two diseases are distinct. Burczynski et al. [16] analyzed transcriptional profiles in peripheral blood mononuclear cells for patients with either Crohn’s disease or ulcerative colitis by hybridization to microarrays of more than 22,000 genetic sequences.
To illustrate that the proposed SVD-DR method can increase the test powers for identifying a difference between two high-dimensional population-mean vectors, we applied each of the five tests to both SVD-reduced and full-dimensional data. We used
randomly-selected patients with Crohn’s disease and
randomly-selected patients with ulcerative colitis. We randomly chose
features to demonstrate the SVD-DR efficacy. In addition, we applied Hotelling’s T2 test to the post-SVD-DR data.
We present the results of the five tests for two high-dimensional mean vectors with and without SVD-DR and Hotelling’s T2 with SVD-DR in Table 1. No difference between the two population mean-vector gene-expression levels of the patient groups was detected by any of the five high-dimensional tests when the tests were applied to the full-dimensional data. However, when SVD-DR was applied to the data prior to performing the five tests, a difference between the two high-dimensional mean vectors of patients with Crohn’s disease and ulcerative colitis was observed for three of the five tests: Thulin [1], Zhang and Pan [13], and Srivastava [4]. On the other hand, the tests from Bai and Saranadasa [3] and Srivastava and Du [5] yielded a relatively small reduction in the test p-value and, therefore, failed to produce a statistically significant result.
The increased power for the random subspaces test proposed by Thulin [1] was not surprising, given the power-curve and power-difference plots in Figure 3 and Figure 4, respectively. However, the increased power for the test proposed by Srivastava [4] was surprising and seems to have occurred because the common sample covariance structure of the reduced data contained many relatively large off-diagonal elements. In addition, Hotelling’s T2 test, conducted with the post-SVD-DR data, detected a difference in the two high-dimensional mean vectors for patients with Crohn’s disease and patients with ulcerative colitis.
6. The Computational Benefit of SVD-DR
In conjunction with improvements in the power, an additional benefit of the SVD-DR application is a reduced computational intensity needed to conduct tests for a difference between two high-dimensional population-mean vectors. For the tests proposed in Bai and Saranadasa [3], Srivastava [4], and Srivastava and Du [5], computation of (1) is time-consuming. The random subspaces test by Thulin [1] and the clustered subspaces Zhang and Pan [13] are also computationally intense because of the increased number of data projections required for high-dimensional data. The application of the SVD-DR method before testing
![]()
Table 1. Test results for bowel disease data with and without SVD-DR.
for a difference between two high-dimensional population means using hierarchical cluster subspaces (Algorithm 2) drastically reduced the computational demand for this test.
To demonstrate the computational efficacy of the SVD-DR method before performing a hypothesis test for the difference in two high-dimensional means, we summarized the computation times for the five tests on the real data introduced in Section 5 with and without the application of SVD-DR to the data in Table 2. The computational times for the tests using SVD-DR include both the time to reduce the data dimension and the time to conduct the test itself.
In Table 2, we observed decreased computation times for all five tests for detecting a difference between two high-dimensional population mean-vectors. In particular, for the Zhang and Pan [13] test, we saw a drastic computational-time reduction from 13.8 hours to 3.04 seconds.
7. Discussion
We have contrasted the changes in powers for five previously-proposed tests for the difference of two high-dimensional population-mean vectors when using the SVD to reduce the dimensionality of the two sample-data sets and with the original high-dimensional data. From Figure 2, we observed that under the configurations with diagonal covariance structures, the tests proposed by Bai and Saranadasa [3], Thulin [1], Srivastava and Du [5], and Zhang and Pan [13] all displayed moderately-increased power for relatively small values of
, when applied to post-SVD-DR data. The Moore-Penrose inverse test proposed by Srivastava [4] demonstrated a mixture of very slightly-increased power and decreased power when the test was performed on SVD-DR data.
For non-diagonal covariance matrices, when SVD-DR was applied to the original data prior to conducting each of the five tests, the random-subspaces test displayed the largest power increase as shown in Figure 4. Also, the test proposed by Zhang and Pan [13] actually lost power for certain values of
for five of the six parameter configurations considered here.
We also applied the five tests for a difference between two high-dimensional population means to actual data from Burczynski et al. [16], which consisted of genetic data from patients with two types of inflammatory bowel disease. After
![]()
Table 2. Computational times in seconds for executing the five tests for two high-dimensional mean vectors on the bowel disease data with SVD-DR data and without first applying the SVD-DR method to reduce the data dimension.
applying SVD-DR to a random subset of variables sampled from the original data, we found that Thulin’s random-subspaces test, Srivastava’s T+2 test, and Zhang and Pan’s cluster-subspaces test identified a difference in the two high-dimensional population-mean vectors of DNA for both patients with Crohn’s disease and patients with ulcerative colitis at the 5% significance level. However, the tests proposed by Bai and Saranadasa [3] and Srivastava and Du [5] did not find evidence of a difference between the two high-dimensional mean vectors when conducted with SVD-DR data. Finally, we demonstrated the computational benefit of applying SVD-DR on a subset of the data from Burczynski et al. [16] prior to conducting the five tests.