Synthesis, Growth and Characterization of Nonlinear Optical Single Crystal of Serine Succinate ()
1. Introduction
Nonlinear optical materials generating second harmonic frequency have a significant impact on laser technology, optical communication and optical storage technology. Nonlinear optics is the study of interaction of radiation with matter in which certain variables describing the response of matter are not proportional to the variables describing the radiation. Nonlinear optical materials play a major role in the technology of photonics. In all materials, nonlinear effects of various types are observed at sufficiently high intensities. Frequency doubling is one of the visually dramatic features among the nonlinear optical processes [1]. Recently semi-organic crystals have been proposed as new candidates with interesting nonlinear optical properties as they possess high thermal and mechanical stability compared to organics [2] [3]. Crystallization of organic materials for use in nonlinear optical devices is of great interest due to their high nonlinearity, high flexibility in terms of molecular structure, high optical damage threshold and low cost [4]. In many organic nonlinear optical materials there is a solid frame work of conjugated π electrons along with weak Vander Waals and hydrogen bonds which are responsible for most of their nonlinear optical properties. Metal complexes like organic compounds have several advantages as far as their third-order nonlinear optical properties are concerned [5].
Organic materials are difficult to grow as large size optical quality crystals for device applications [6]. Combined organic and inorganic, named semi-organic, can be grown easily by solution growth technique [7]. Semi-organic materials gain importance over inorganic materials, because of their large polarizability, wide transmission, and high laser damage threshold [8]. Semi-organic materials have the potential for combining the high optical nonlinearity and chemical flexibility of inorganic material [9]. Only non-centrosymmetric alignment of the chromophores in the crystal lattice leads to an observable bulk second-order nonlinear response [10]. In order to obtain the adjustment of the nonlinear efficiency, based on the molecular engineering and crystal engineering approach, it is tried to develop a new method to design organic nonlinear optical second harmonic generation materials such as organic inclusion complex [11]. In this study, the crystal growth of serine succinate by slow evaporation technique and its characterization along with its optical properties are reported.
2. Experimental Description
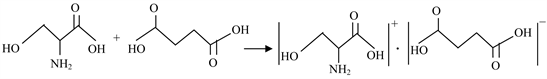
Solution method with slow evaporation technique was adopted to grow the single crystals of the synthesized salt of serine and succinic acid with three different solvents namely ethanol, methanol and water. Serine and succinic acid were taken in the stoichiometric ratio 1:2 in ethanol and the mixture (SSAE) is stirred for 3 hour. The same procedure was adopted by taking serine and succinic acid in methanol (SSAM), serine and succinic acid in ethanol-methanol (SSAEM) and serine and succinic acid in ethanol-water (SSAEW) in the ratio 1:2. The mixture materials were stirred for 3 hours using magnetic stirrer at room temperature (31˚C). Then the solutions were filtered in beakers to remove the dust particles. The beakers were kept safely for the growth of crystals. The crystal growth phenomena were observed in each case. After two days, small crystals of serine succinate were appeared. Among the three solvents used to grow crystals, mixture materials stirred in the combination of serine, succinic acid and ethanol are grown as good quality transparent crystals. Crystals of suitable dimensions required for various characterization techniques were allowed to grow and harvested in two weeks. Photograph of such grown crystal is shown in Figure 1. The following reaction shows the formation of SSA crystals.
3. Results and Discussion
3.1. Single Crystal XRD
Single crystal X-ray diffraction data for SSAE was recorded by using BRUKER-NONIUS KAPPA APEX II CCD diffractometer system using Mo Kα graphite monochromatic radiation. It is observed from the X-ray diffraction data that the grown crystal is monoclinic and the space group is P. The lattice parameters have been determined as: a = 5.07 Å, b = 8.81 Å, c = 5.50 Å, α = 90.00˚, β = 91.06˚, γ = 90.00˚ and the volume of the unit cell is found to be V = 246 Å3.
3.2. FTIR Spectral Analysis
Fourier transform infrared spectroscopic studies were carried out in the region 400 cm−1 - 4000 cm−1, it is recorded on Perkin Elmer FTIR spectrophotometer using KBr pellet technique [12]. The recorded spectra for SSAE, SSAM, SSAEM and SSAEW are shown in Figures 2(a)-(d).
In Figure 2(a) SSAE displays the aliphatic C-H symmetric stretching as a band at 2933 cm−1 [13]. The C-H symmetric in plane bend occurs at 1418 cm−1. The peak at 1177 cm−1 is due to C-C skeletal vibration. The C-H deformation vibration appears at 896 cm−1.
In Figure 2(b) SSAM displays the aliphatic C-H symmetric stretching at 2933 cm−1. The symmetric stretching mode of C-H in plane bend group appears at 1418 cm−1. The absorption peak at 1177 cm−1 corresponds to C-C stretching vibration. The bending mode of C-H vibration occurs at 895 cm−1.
In Figure 2(c) SSAEM displays the symmetry stretching vibration of CH2 group at 2933 cm−1. The peak at 1418 cm−1 is assigned to symmetrical COO− ion group stretching. The peak appears at 1202 cm−1 is due to C-C skeletal vibration. The clusters of peaks below 1000 cm−1 are due to C-H bending. A well-defined peak observed at 894 cm−1 and other sharp peaks identified in the low wave number regions are due to the bending vibration mode of C-H bend.
In Figure 2(d) SSAEW displays the broad peak at 2933 cm−1 corresponds to C-H stretching vibrations. Skeletal vibrations observed at 1418 cm−1 are due to in plane bending modes of C-H bonds. The peak at 1177 cm−1 is due to C-C stretching vibration. The peak at 895 cm−1 is attributed to C-H deformation vibration [14]. The comparison of FTIR spectral assignments for various solvents is shown in Table 1.
3.3. UV-VIS-NIR Spectral Analysis
The optical transmission spectrum of serine succinate crystal was recorded Perkin Elmer Lamda 35 spectrophotometer in the wavelength range of 1100 nm - 200 nm. The obtained transmission spectrum of SSAE, SSAM, SSAEM and SSAEW are shown in Figure 3. In SSAE transmittance between 200 - 1100 nm is approximately 100% and the upper cut off wavelength is found at 300 nm. In SSAM transmittance between 200 nm - 1100 nm is approximately 97% and the upper cut off wave length is found at 250 nm. In SSAEM transmittance between 200 nm - 1100 nm is approximately 99% and the upper cut off wavelength is found at 240 nm.
In SSAEW transmittance between 200 nm - 1100 nm is approximately 95% and the upper cut off wavelength is found at 250 nm. The absence of absorption in the visible region confirms to the colourless nature of the crystal and is an advantage as it is the key requirement for materials having NLO properties [15]. The comparison of transmission of SSAE, SSAM, SSAEM and SSAEW is shown in Table 2. Serine, succinic acid and ethanol mixture (SSAE) has high percentage of transmittance (100%) compared to the mixture of methanol, mixture of ethanol-methanol and mixture of ethanol-water.
![]()
Table 1. Comparison of FTIR spectral assignments.
![]()
Figure 3. UV transmission spectrum of SSA.
![]()
Table 2. Comparison of UV-VIS-NIR studies.
3.4. Fluorescence Study
Fluorescence generally found in compounds containing aromatic functional groups with low energy п → п+ transition levels. Compounds of aliphatic and alicyclic carbonyl structures are highly conjugated double bond structures exhibit fluorescence. The emission spectrum of SSA was recorded using Helium-Neon laser as the excitation source and JOBINVYON FLUROLOG 3 Spectrofluorometer in the range 250 - 600 nm. The Fluorescence spectrum of SSA is given in Figure 4.
The fluorescence spectrum shows a peak at about 465.87 nm which indicates that the SSA crystal has a blue fluorescence emission [16] [17].
3.5. Mechanical Studies
The permanent deformation can be achieved by indentation, bending, scratching or cutting. The Vicker’s hardness number (Hν) was calculated using the formula,
where,
Hν is the Vicker’s hardness number in kg/mm2.
P is the applied load in kg.
d is the diagonal length of the impression in mm.
The variation of Hν with load is given in Figure 5 and plot of logP versus logd is shown in Figure 6. It is evident from the Figure 5 that Hv increases with increase in load upto 100 g and further increase in load causes cracks formation which leads the decrease in hardness value.
The relation between P and d is represented by Meyer’s law P = Adn.
where A is standard hardness and n is constant. The Meyer’s index number “n”
determined for SSA crystal is 3.2. According to Onitsch [18] and Hanneman [19] [20] “n” should be between 1 and 1.6 for hard materials and above 1.6 for softer ones. Hence SSA belongs to softer material category.
The elastic stiffness constant (C11) for different loads is calculated using wooster’s empirical formula,
.
Graph between load P and stiffness constant C11 shown in Figure 7 gives an idea about tightness of bonding between neighboring atoms. It also determines the intensity of the fracture stress under the uniform loading shown in Figure 8 and brittleness indexBi shown in Figure 9 and the yield strength σy shown in Figure 10. The calculated mechanical parameter values of SSA are given in Table 3. It is evident from Table 3 that the parameter values are increased due to increase in load but decreased Brittle index.
3.6. FT-Raman Spectral Analysis
The FT-Raman spectrum of the SSA was recorded on a BRUKER RFS 27 FT-Raman spectrometer equipped with an FRA-106 FT-Raman accessory in the region 4000 - 500 cm−1 using the 1064 nm line of Nd: YAG laser for excitation operating at 200 mW power with a resolution of 1 cm−1. The FT-Raman spectrum shown in Figure 11 also confirms the functional group. The intensity of the peaks in the spectrum is due to more free exposure for different groups. The
![]()
Table 3. Mechanical parameter values of SSA.
C-H symmetric stretching is observed at 2967.82 cm−1 as an intense sharp peak. The C-H stretching appears at 1418.97 cm−1 is due to the skeletal vibration. The C-C stretching mode occurs at 1292.57 cm−1. The peak at 936 cm−1 illustrates the out of plane bending modes of C-H bond.
3.7. Nonlinear Optical Studies
The nonlinear optical property of the grown SSA crystal is studied using Kurtz second harmonic generation (SHG) test. The crystal with reference to potassium dihydrogen orthophosphate (KDP) was carried out using Kurtz powder technique developed by Kurtz and Perry. The crystal was ground to homogeneous powder and tightly packed in a micro capillary tube and mounted in the path of the Q-switched Nd: YAG laser beam emitting 1064 nm, 15 ns pulse width with a repetition rate of 10 Hz and 7 mJ power [21]. The generated SHG signal at 532 nm is separated from the fundamental frequency using an IR separator. Further the emission of green light confirms the second harmonic generation on serine succinate crystal. The SHG efficiency of SSA material was found to be five times higher than that of standard potassium dihydrogen orthophosphate (KDP).
3.8. Thermal Studies
Thermal behaviour of the crystal was assessed by thermo gravimetric analysis (TGA), differential thermal analysis (DTA) and differential scanning calorimetry (DSC) using the instrument NETZSEH-STA 449 F3 GUPITER. The TGA was carried out in nitrogen atmosphere at a heating rate of 20˚C per minute in the temperature range of 0˚C to 350˚C. Figures 12-14 illustrates TG-DTG, TG-DSC and DSC curves for the grown SSA sample.
The curve shows a sharp weight loss at 190˚C without any intermediate stages, which is assigned as melting point of the crystal [22]. There is no weight loss below 190˚C, illustrating the absence of absorbed water in the crystal.
Hence, we can conclude that there is no change in the melting point of the serine due to the addition of succinic acid. From the DSC trace, the endothermic peak observed at 190˚C may be attributed to decomposition of succinic acid [23].
3.9. SEM Analysis
The SEM micrograph of SSA is shown in Figure 15. The photograph clearly reveals the step like growth pattern on the surface of the growth crystal and also
the formation of few isolated islands. As the duration of irradiation increased, the morphology of the SSA crystallites changed markedly, with characteristic hexagonal shapes appearing after about1 min, longer durations resulted in the formation of distinct hexagonal. It is observed that the diameters are varied between 80 and 100 nm, with lengths up to 500 - 600 nm. The wall thickness of the SSA structure is about 40 nm.
4. Conclusion
The nonlinear optical crystal of serine succinate is synthesized and grown from slow evaporation method at room temperature. The various characterization techniques have been employed to confirm the grown crystals such as single crystal XRD, FT-IR, UV-VIS-NIR, Fluorescence, mechanical studies, FT-Raman analysis, nonlinear optical property, thermal studies and SEM analysis. The single crystal X-ray diffraction data confirms that the grown crystal is monoclinic and the space group is P. The lattice parameters are a = 5.07 Å, b = 8.81 Å, c = 5.50 Å, α = 90.00˚, β = 91.06˚, γ = 90.00˚ and Volume = 246 Å3. The recorded FT-IR and FT-RAMAN spectrum of the grown crystal confirms the presence of functional groups in the compound. The UV-VIS-NIR transmission spectrum shows good transparency and the upper cut off wavelength is found to be 300 nm. The fluorescence spectrum shows an emission peak at 465.87 nm and indicates that the crystal has blue emission of radiation. The micro hardness study reveals that the hardness increases with increases the load. Mechanical parameter values are also calculated for the sample. The SHG efficiency of the grown crystal is about five times that of potassium dihydrogen orthophosphate. The thermal behaviour of the crystal was confirmed by TGA analysis. Scanning electron microscopy study for the grown sample shows the surface quality of the crystals.
Acknowledgements
The authors thank the Indian Institute of Science-Bangalore for SHG measurement, Sophisticated Analytical Instruments Facility-Indian Institute of Technology, Chennai for the support in Single Crystal XRD data collection, FT-Raman, Thermal analysis and Archbishop Casimir Instrumentation Centre, St. Joseph College-Tiruchirappalli for FTIR, UV-VIS-NIR, Fluorescence, mechanical and SEM data analysis.