Unemployment Rate in ECCAS Countries: Structural Changes and Stochastic Convergence ()
1. Introduction
The economic slowdown that Africa has experienced in recent years as a result of external shocks is marked by high inflation coupled with high unemployment (Yaya, Ogbonna, & Mudida, 2019). Thus, according to the World Bank (2014), until 2024, only one in four young people in sub-Saharan Africa will find jobs, only a small fraction of which will be in the formal sector.
This situation of rising unemployment rates over time, which prevails in most African countries, has become very worrying. Whether the Economic Community of Central African States (ECCAS), one of whose characteristics is intermember labor mobility, is likely to be affected by this scourge is of real interest, both theoretical and empirical.
In this respect, there are two contradictory hypotheses in the theoretical literature, namely, the hysteresis hypothesis and the natural unemployment rate hypothesis. According to the hysteresis hypothesis, a shock may permanently move the effective unemployment rate from its long-term level (Blanchard & Summers, 1986). In contrast, the natural unemployment rate hypothesis suggests that a shock only temporarily moves the effective unemployment rate from its natural level. Empirically, the literature is inconclusive about the presence or absence of hysteresis (Monfort et al., 2016). Additionally, Krištić et al. (2018), unlike other authors (Lee, 2010; Chang, 2011; Meng et al., 2017), have highlighted the existence of stochastic convergence of unemployment rates in the euro zone countries over the period 1995-2016. These divergent findings on the issue under review justify the interest in extending the discussion to ECCAS countries to contribute to the existing literature.
Also, statistics (WDI, 2018) show that on average, ECCAS countries have high unemployment rates. In general, between 1991 and 2003, unemployment rates in Angola and the Congo had the highest levels observed in the period. This can be explained by situations of sociopolitical unrest. On the other hand, the period afterwards shows a downward trend in the unemployment rates in these same countries. This downward trend can be explained by the exit of these countries from the series of civil wars and a decade of spectacular growth fueled by oil, of which Angola and Congo became the second and sixth African producers, respectively, after Nigeria.
In contrast, Rwanda and Chad had the lowest unemployment rates over the entire period under review. This can be attributed not only to the potential effectiveness of some of the employment programs (or projects) that have been put in place but also, more importantly, to the size of the informal sector. In other words, each of these countries has adopted programs (or projects) that have probably allowed their labor market structure to facilitate the absorption of any proportion of the available labor force. Thus, the considerable weight of the informal sector in these developing countries does indeed serve as a real mask of open unemployment. This swelling of the informal sector in these developing countries, which is the result of the crisis in formal employment, does not allow for the best possible portrayal of the labor market situation.
Congo, Gabon, and Sao Tome and Principe had unemployment rates above the subregional average throughout the period. In the case of Equatorial Guinea, only the 2015-2018 period shows unemployment rates above the subregional average. On the other hand, in Angola, the trend for the same period (2015-2018) is toward below-average unemployment rates. There is, therefore, a diversity of labor market situations in ECCAS countries.
Additionally, with reference to developed countries, particularly the USA, with the exception of 2009 (due to the Great Recession), the unemployment rates for the period under review are below the ECCAS average. This reflects, overall, the high levels of unemployment in all ECCAS countries.
It should be noted that little work has been done in Africa, particularly in ECCAS countries, testing the hysteresis hypothesis and applying the stochastic divergence hypothesis test. Thus, as in Krištić et al. (2018), the objective of this research is twofold. First, it is to specify the dates of potential breaks (or shocks) while verifying whether these shocks, notably the accession to CEMAC, could have generated permanent effects. Second, the hypothesis of stochastic divergence in the unemployment rate is tested. Because of the low mobility of the labor force in ECCAS countries, it is argued in this work that this zone is not invulnerable, on the one hand, to persistence of high unemployment rates and, on the other, to stochastic divergence of unemployment rates.
In addition to the introduction and conclusion, this research paper includes three sections. The first provides the literature review; the second deals with the presentation of the methodology and the third is devoted to the results and their discussion.
2. Review of the Literature
Changes in unemployment have important implications for the conduct of macroeconomic policy (Cevik, Diboogluand, & Barişik, 2013). Thus, a number of theoretical and empirical perspectives have been developed to explain the evolution of unemployment over time.
From a theoretical point of view, two main hypotheses associated with the link between economic shocks and unemployment should be distinguished. The first, known as the NAIRU (nonaccelerating inflation rate of unemployment) hypothesis, posits a natural unemployment rate relative to stable inflation. This hypothesis, developed mainly by Phelps (1968) and Friedman (1968), characterizes unemployment dynamics as a stationary process that is compatible with a stable inflation rate. In other words, the NAIRU hypothesis suggests that while the effective unemployment rate can fall below its natural level in the short run, the interplay of expectations results in it returning to its natural level in the long run. The natural rate corresponds to the long-term trend, around which fluctuations appear, reflecting movements in the effective unemployment rate. It should be noted that these fluctuations are transitory and do not affect the long-term trend. It follows that Friedman’s natural unemployment rate, in the sense of the equilibrium value, is invariant, unique and stable in the short and medium term. Thus, according to the NAIRU hypothesis, a shock can only temporarily deviate the effective unemployment rate from its natural level.
In contrast to this first hypothesis, the second, known as the hysteresis hypothesis (Blanchard & Summers, 1986), calls Friedman’s (1968) vision into question. According to the hysteresis hypothesis, the effective unemployment rate returns to its natural value. Consequently, the gap between the effective unemployment rate and the natural unemployment rate tends to diminish over time. Moreover, unemployment dynamics are considered to be a nonstationary process; that is, a shock may permanently move the effective unemployment rate away from its long-term level. Thus, the consequences are permanent since the unemployment rate never returns to its natural level. The fundamental consequence of this is variation in the natural unemployment rate insofar as it depends on the evolution of previous effective unemployment rates. The notion of the natural unemployment rate as presented by Friedman (1968) then loses its meaning.
Apart from these two hypotheses mentioned above, there is also the hypothesis of the structuralists, who see the natural unemployment rate as endogenous and affected by market forces, like any other economic variable (Layard, Nickell, & Jackman, 1991), which leaves room for a dynamic natural unemployment rate due to changes in real macroeconomic variables. Indeed, in this structuralist view, the existence of (permanent) structural breaks in the trajectory of the natural unemployment rate is consistent with the unemployment series being a stationary process.
From an empirical point of view, a large body of literature, particularly on European countries, has documented the persistence of shocks to unemployment rates, that is, unemployment hysteresis, and the convergence of unemployment rates. According to Monfort et al. (2016), this empirical literature is inconclusive regarding the presence or absence of the hysteresis effect. For Blanchard & Summers (1986), who focus on Europe, demand shocks are likely to have a permanent effect on the unemployment rate. From this point of view, the hypothesis of unemployment hysteresis is verified. In turn, Lee (2010), Chang (2011) and Meng et al. (2017), like Blanchard & Summers (1986), show evidence of the hysteresis phenomenon in a sample of OECD countries by using different linear and nonlinear unit root tests. However, these authors do not analyze the influence of euro area membership on the unemployment rate using unit root tests.
Krištić et al. (2018), conclude, like previous authors, that the hysteresis hypothesis is verified in the context of the euro zone. However, these authors stand out from the others by showing the existence of stochastic convergence of unemployment rates. In the context of South Africa, Pikoko & Andrew Phiri (2018) conclude, like Krištić et al. (2018), that the hysteresis hypothesis is confirmed for the majority of unemployment categories, with the exception of unemployment of persons aged 55 - 64. Contrary to previous findings, Arestis & Mariscal (1999), Papell et al. (2000), Song and Wu (1997; 1998), and Lee et al. (2001) reject the hysteresis hypothesis for the sample of OECD countries after controlling for structural changes. Njoda & Ulrich (2015), who consider the informal employment rate (over the period 1981-2012), find that the hysteresis hypothesis is not verified in two CEMAC countries, namely, Gabon and Republic of Congo. On the other hand, Yaya, Ogbonna, & Mudida (2019), consider the majority of African countries (over the period 1991-2017) and come to the conclusion that the hysteresis hypothesis is verified in only seven (7) countries out of the forty-two (42) African countries.
Although the work on the hysteresis hypothesis is inconclusive, Ball (2009) concludes that it is clear that some form of hysteresis exists. Thus, he suggests that where hysteresis exists, it is not appropriate for central banks to focus on fighting inflation since it could create unnecessarily high unemployment. Even if the natural rate of unemployment is independent of monetary policy, central banks, by focusing solely on fighting inflation, can, in the worst case scenario, exacerbate the dynamics of unemployment in the short term.
With regard to the verification of the convergence of unemployment rates, Bayer & Juessen (2007) test the convergence hypothesis in Germany. Using various unit root tests, these authors, like Krištić et al. (2018), obtain strong evidence of convergence among the German federal states. The same is true for Estrada et al. (2013), who focus on the convergence of unemployment rates in the context of the euro zone countries. However, they analyze the measure of unemployment rate dispersion to determine the extent of macroeconomic convergence and the role of the euro area as a factor in convergence. These authors conclude in favor of the existence of convergence in the countries of the euro zone. Pesaran (2007), on the other hand, tests the hypothesis of stochastic divergence between all possible pairs of euro area countries while avoiding the arbitrary choice of a reference country. Pesaran (2007) reaches the same conclusions as the other authors.
This literature reveals that the discussion around the issue of hysteresis is not exhausted and continues to yield controversial results. In other words, this problem is topical and struggles to find a solution in the existing literature. Despite the fact that solving unemployment is a major challenge for government authorities, the issue of hysteresis is not widely discussed in ECCAS countries, which have high unemployment rates. In this sense, focusing on these countries as a field of investigation will make the research more rigorous in that it complements and improves the existing literature on the issue under review.
3. Methodological Approach
3.1. Data Source and Description
The data used in this research were taken from the World Bank’s World Development Indicators Database (WDI, 2018). This WDI (2018) database provides a wide range of data for research purposes. The unemployment rates extracted from this database for the eleven (11) ECCAS countries are expressed as a percentage of the total number of unemployed in the total labor force.
Table 1 shows the evolution of unemployment (as a percentage of the labor force) in all ECCAS countries from 1991 to 2018.
This table shows that the unemployment rate averages 8.52 per cent. There are disparities between Angola, Congo, and Gabon, which have high unemployment rates, and Rwanda, Chad, and CAR, which have low unemployment rates. These differences can be explained by differences in the performance of the productive systems, training systems that are incompatible with the needs of the working world, socio-political conflicts, and so on.
It should be pointed out that most authors researching this topic, among them Yaya, Ogbonna & Mudida (2019), use this unemployment indicator, which provides information to improve the understanding of the unemployment
![]()
Table 1. Trends in the unemployment rate in all ECCAS countries and in the USA.
Source: Authors, based on World Bank data (WDI, 2018). ECCAS average unemployment rate: 8.519.
phenomenon in the selected countries. Key information on the selected unemployment indicator is provided in Table 2.
It should not be forgotten that the definition used for the construction of this unemployment indicator is that of the ILO. Thus, according to the ILO (since 1982), an unemployed person is a person of working age (15 years and over) who 1) has not worked even one hour during the reference week; 2) is available for work within two weeks; and 3) is actively looking for work. This definition as presented seems restrictive and excludes not only the discouraged unemployed (those who have stopped actively looking for work) but also all those who work in the informal sector (or who engage in agricultural activity). In other words, this definition does not take into account precarious employment, natural unemployment and underemployment in the informal sector. All these restrictions contribute to underestimating the unemployment rate (and thus to artificially low unemployment rates) in African countries, where the computerization rate is on the order of 60% and higher (BIT, 2019). In the same vein, the Brookings Institution considers underemployment as a serious problem that masks the reality in developing countries by bringing down official unemployment rates.
Additionally, for international comparisons, this ILO definition is preferred since the broader definition of unemployment differs across countries. Therefore, in the case of this work, the indicator of unemployment related to the ILO definition and measure is used.
These data, initially at annual frequency (over the period 1991-2018), were transformed to quarterly frequency by the Goldstein-Khan method to increase the number of observations and guarantee the conditions of approximation to a
![]()
Table 2. Description of the unemployment indicator for ECCAS countries.
Source: Authors, based on World Bank data (WDI, 2018).
reduced centered normal distribution (a preliminary step in the treatment of time series). This transformation methodology is chosen not only because of its simplicity but also because it seems, among many others, to be the most widely used in the literature.
The data on the unemployment rate concern all ECCAS countries, namely, Angola, Burundi, Central African Republic, Cameroon, D.R. Congo, Congo, Gabon, Equatorial Guinea, Rwanda, Sao Tome and Principe and Chad. The period covered by this research extends from the first quarter of 1992 to the first quarter of 2017, i.e., 101 observations.
3.2. Identification of Break Dates and Stochastic Convergence
As in Krištić et al. (2018), the methodology adopted is twofold. The first component is attempts to detect the dates of structural breaks (or shocks) as well as verify whether these shocks, notably CEMAC accession, generated permanent effects. The second component consists, in turn, of testing the hypothesis of stochastic divergence.
For the first component, unit root tests with regime changes are applied to the unemployment rate series of the countries in the considered sample (
). Rejection of the null hypothesis for these tests reflects the absence of the hysteresis effect (or the presence of transitory effects following a shock).
The second component, for its part, applies the same unit root tests to the series of relative unemployment rates (
).
The relative unemployment rate (
) for each country considered in this work is the unemployment rate of country i (
) adjusted to the average of the unemployment rates of a set of countries considered (
). Two relative unemployment rates, namely, the relative unemployment rate for CEMAC countries and that of all ECCAS countries, are used to test the hypothesis of stochastic divergence.
Formally, the relative unemployment rate (
) is as follows:
(1)
The rejection of the null hypothesis of divergence leads to the conclusion of nondivergence, i.e., stochastic convergence (Bernard & Durlauf, 1995, 1996; Pesaran, 2007; Gomes & da Silva, 2009; Meng et al., 2013). In other words, following a shock, the unemployment rate of country i (
) can only deviate temporarily from its reference level (
). According to Pesaran (2007), the choice of an arbitrary reference level can influence the results obtained from the convergence test. To avoid this kind of bias and, therefore, to achieve robust results, the reference level (
) considered is the average of the unemployment rate of the group considered.
The unit root tests mobilized for this purpose are the Augmented Dickey-Fuller (ADF) test without structural breaks, the Lagrange multiplier (LM) test with two breaks (Lee & Strazicich, 2003) and the Lagrange multiplier of residual augmented least squares (RALS-LM) test with two breaks (Meng et al., 2016).
Additionally, a comparison of the results obtained from the standard ADF test and the tests with structural breaks (LM and RALS-LM) is conducted. The use of nonlinear unit root tests, as in Krištić et al. (2018), has a double interest. First, according to Perron (1989), the linear unit root test loses its power in the presence of structural breaks. Second, countries’ accession to CEMAC or experience of various crises could be considered structural breaks that affect the behavior of unemployment rates.
The ADF test for unemployment rate series can be specified as:
(2)
where
is the unemployment rate and
and t are the constant and linear trends, respectively. The observation of the trend of the selected unemployment rate series seems to show structural changes (cf. Appendix 2). Thus, the ADF test, as indicated above, is ineffective because of the poor specification of the deterministic trend (Perron, 1989). To overcome this difficulty, several tests have been proposed, among them ( Perron, 1989; 1997;
In turn, the LM unit root test with two breaks was proposed by Lee & Strazicich (2003). Following the LM (score) principle, the test statistic is obtained from the following regression:
(3)
where
is an adjusted series such that
, for
,
is a vector of the regression parameters of
on
,
of which
and
are, respectively, the first observations of
and
, and
is an error term. Additionally,
, where
for
,
and 0 if not.
The unit root test of the RALS-LM with two breaks was developed by Meng et al. (2016). This test incorporates information on nonnormal errors (ignored in the literature on unit root tests (Mishra & Smyth, 2017)) and is more efficient than the usual LM test. The statistic of the RALS-LM (transformed) test is obtained by the following regression:
(4)
where
is an error term and Equation (4) is similar to Equation (3) considering
, where
is the RALS (augmented) term that uses nonnormal error information and is not correlated with
. Meng et al. (2016) use the second- and third-order moments of the estimated residuals for this purpose. Similar to the two-break LM unit root test, the RALS-LM test does not depend on nuisance parameters and allows trend breaks under the null hypothesis. Similarly, the variance of the error term in Equation (4) is smaller than that in Equation (3). Thus, compared to the LM test, the RALS-LM test provides asymptotic efficiency gains for nonnormal errors. In fact, the RALS-LM test gains power in the presence of nonnormal errors. These tests are useful since they allow breaks in both hypotheses (null and alternative) and their properties are not affected by breaks under the null hypothesis. The optimal number of lags for these tests is set at eight (8), based on the general-to-specific procedure (Hendry, 1993). The model chosen for the execution of these tests is the model with trend breaks, thus allowing two breaks, with both the constant and the trend.
4. Estimation Results and Discussion
Table 3 below presents the main statistics on the unemployment series of the sample of countries covered by this research.
The number of observations in the unemployment rate series for each country in the sample amounts to 101. Therefore, it is possible to approximate the normal distribution of the series studied. Out of the entire sample of ECCAS countries, Gabon, Congo and Angola display the highest average unemployment rates
![]()
Table 3. Descriptive statistics of the unemployment rate in ECCAS countries.
Source: Authors, based on World Bank data (WDI, 2018).
for the period under review. Conversely, Rwanda and Chad have the lowest average unemployment rates per quarter for the same period. This difference can be attributed to the greater ability of the economies of Rwanda and Chad to absorb any part of their labor force and thus to smooth the performance of their labor markets. In other words, the employment programs (or projects) run by these countries are much more effective than those in the other countries in the sample. Additionally, the highest unemployment rates are observed for Angola, Congo, and Gabon. On the other hand, the lowest unemployment rates are seen for Rwanda and Chad. The first quarter of 1992 marks the lowest level of unemployment recorded in Rwanda. This is related to the economic liberalization that began in the early 1990s, which contributed to the creation of a greater number of jobs. Chad also had a lower unemployment rate in the same period. The explanation for this may come from the Education Training Employment (ETE) program that Chad benefited from in 1991. This project, financed by the UNDP and executed by the ILO and UNESCO, aimed to adapt education and vocational training to combat unemployment, etc. The highest levels of unemployment can be explained by the post-civil war period (the first quarter of 2004) in Angola, sociopolitical unrest (the first quarter of 1993) in Congo and the financial crisis (the fourth quarter of 2009) in Gabon.
Nevertheless, a concentration of unemployment rates around their average level can be observed in the entire sample of ECCAS countries.
The results obtained from the application of the linear (ADF) and nonlinear (LM and RALS-LM) unit root tests are reported in Tables 4-6. The analysis of the results will consist of comparing the results of the linear and nonlinear unit root tests while drawing conclusions on the basis of the RALS-LM test, which is more efficient. Table 4 provides, in brief, the results relating to the first part of the methodology used. Table 5 and Table 6 present the results related to the second part of our methodology.
After applying the ADF and LM tests used, the results obtained (Table 4) indicate that with the exception of Congo and Equatorial Guinea, all ECCAS countries have unemployment rates that contain unit roots. Indeed, the calculated statistics of the tests used are, overall, below their critical values; which, as indicated, would lead to the conclusion that the unemployment rate series of all ECCAS countries are nonstationary. Contrary to the ADF and LM tests, the results of the RALS-LM test show that only the unemployment rates of Burundi, Cameroon and Chad are not stationary. In other words, according to the RALS-LM test, the majority of ECCAS countries have unemployment rates that are stationary. On the basis of the latter test, nineteen (19) dates of potential structural breaks were detected. These breaks do indeed correspond to shocks originating in changes in the trajectory of the unemployment rate series while inducing mostly transitory effects for the entire sample of ECCAS countries. Table 5 and Table 6 provide the results of the stochastic divergence hypothesis test.
The ADF and LM tests, applied to the relative unemployment rates of all ECCAS countries, indicate that the hypothesis of stochastic divergence is generally
![]()
Table 4. ADF test and LM and RALS-LM tests with two (2) regime changes on the unemployment time series of ECCAS countries.
Source: Authors, based on data from the (WDI) World Bank’s World Development Indicators (2018).
not rejected, with the exception of Equatorial Guinea (for both tests), Sao Tome and Principe (for the LM test) and Chad (for the LM test). On the other hand, based on the RALS-LM test, only the unemployment rate series for Burundi, Cameroon and Chad are not stationary. In other words, the hypothesis of stochastic divergence is rejected for the majority of ECCAS countries. Thus, in the
![]()
Table 5. ADF tests and LM and RALS-LM tests with two (2) regime changes on the deviation of unemployment from its average level in the ECCAS zone.
Source: Authors, based on data from the (WDI) World Bank’s World Development Indicators (2018).
ECCAS region, following a shock, most unemployment rates converge towards their subregional reference level. According to the RALS-LM test, twenty-one (21) dates of potential structural breaks are identified. These dates represent events that can be explained by the convergence of unemployment rates in ECCAS countries. Considering only the CEMAC countries, the results of the stochastic divergence hypothesis test are shown in Table 6 below.
![]()
Table 6. ADF test and LM and RALS-LM tests with two (2) regime changes on the deviation of unemployment from its average level in the CEMAC zone.
Source: Authors, based on data from the (WDI) World Bank’s World Development Indicators (2018).
With the exception of Equatorial Guinea and Chad (for the ADF and LM tests), in general, the unit root tests applied reveal nonrejection of the hypothesis of stochastic divergence of unemployment rates in CEMAC countries. However, on the basis of the RALS-LM test, except for Cameroon, the hypothesis of stochastic divergence is rejected. In other words, in all CEMAC countries, there is stochastic convergence. Twelve (12) dates of potential structural breaks, which condition this phenomenon, were identified following the application of the RALS-LM test.
From the analysis of our results, two general lessons can be drawn: namely, on the one hand, that the hysteresis effect is absent and, on the other, that stochastic convergence of the unemployment rate is present in ECCAS countries.
1) Changes in trajectories and absence of hysteresis in the unemployment rate: a characteristic feature of ECCAS countries
Overall, the results suggest that after a shock, the unemployment rate deviates from its long-term level. A change in trajectory marks the return to this long-term level, which allows us to argue that there is no hysteresis phenomenon. Indeed, several major events have changed the trajectory of unemployment rates in ECCAS countries.
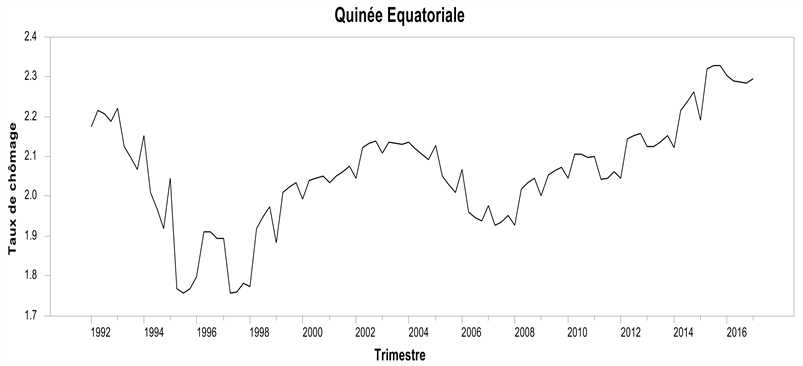
In Equatorial Guinea, the last quarter of 1994 and the third quarter of 1995 are dates of major structural breaks in the unemployment rate series. The 1994 devaluation and the accession to CEMAC may be at the origin of the changes in the trajectories of the unemployment rate series of this country. That said, the effects of the devaluation and CEMAC accession on the country’s unemployment rate are transitory.
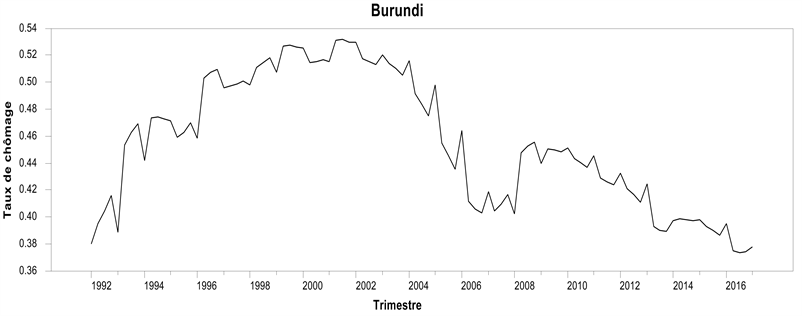
In Burundi, the last quarter of 1995 and the third quarter of 1996 are potential dates for major events that changed the trajectory of the unemployment rate. These major structural disruptions are related to the sharp contraction in export earnings and the substantial increase in public debt, with persistent effects on Burundi’s unemployment rate.
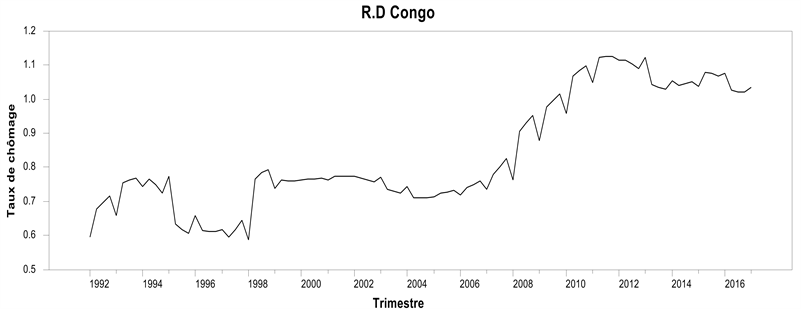
In the DRC, the unemployment rate experienced two major disruptions. The last quarter of 1997 and the third quarter of 1998 are the dates of these structural breaks. These dates relate to security and structural-institutional shocks, which had temporary effects on the unemployment rate in the DRC.
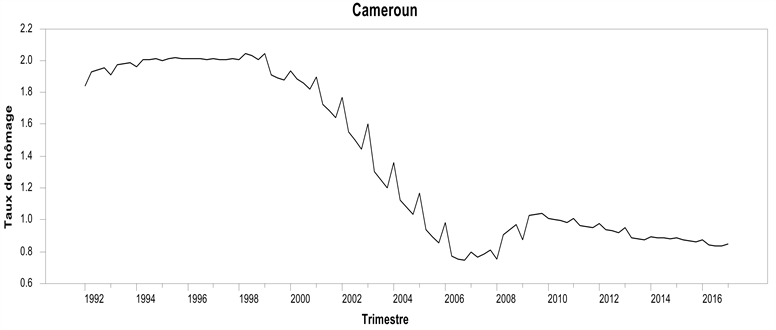
In Cameroon, two dates of structural breaks are identified in the unemployment rate series. The third quarter of 2000 and the fourth quarter of 2006 are the dates of these changes in the trajectories of the unemployment rate series in this country. The country’s achievement of eligibility for the enhanced HIPC debt relief initiative (in 2000) and the arrival to the HIPC completion point (in 2006) can be considered major events that changed the trajectory of the unemployment rate in Cameroon, with permanent effects.
The fourth quarter of 2000 and the third quarter of 2001 are dates when the unemployment rate series in Sao Tome and Principe presents structural breaks. During this period (2000-2001), a new poverty reduction plan aimed at sectors with significant potential to impact growth and job creation, especially for young people, strengthened the competitiveness of the economy. Thus, the measures related to this new poverty reduction plan not only changed the trajectory but also induced transitory effects on the unemployment rate in Sao Tome and Principe.
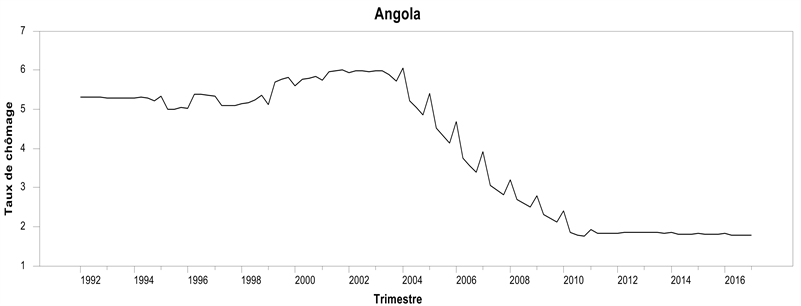
In Angola, the third quarter of 2003 and the first quarter of 2008 mark the dates of structural breaks in the unemployment rate series. The trend towards positive GDP growth rates that began after the war was accompanied by an increase in private consumption from 2003 and contributed to an improvement of household welfare and subsequent poverty reduction. The year 2008 is associated with the financial crisis. It is clear that the end of the civil wars and the financial crisis fundamentally altered Angola’s unemployment rate series. However, these events had only temporary effects on the unemployment rate in this country.
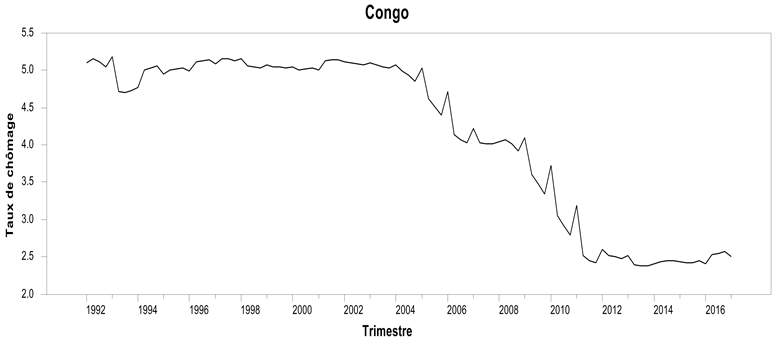
The fourth quarter of 2004 and the first quarter of 2011 mark the dates of major structural breaks in the series of the unemployment rate of Congo. The beginning of the 2000s was marked by an inflection in the unemployment rate, which fell from 19.4% (ECOM, 2005) to 6.9% (ECOM, 2011). This is because the private sector generated more than 15,000 new decent jobs during this period. Thus, this dynamism of the private sector created jobs that had transitory effects on the country’s chronic unemployment.
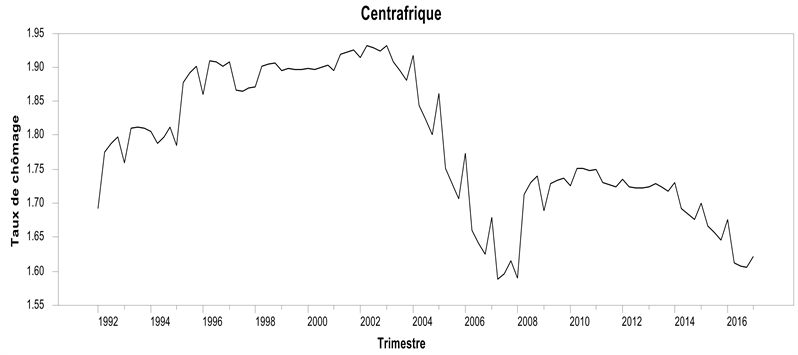
In Gabon, the fourth quarter of 2007 associated with the financial crisis and the first quarter of 2010 linked to a rise in employment, are dates of major structural disruptions. These events had temporary effects on Gabon’s unemployment rate series.
Rwanda and CAR display major structural breaks on the same dates (the fourth quarter of 2007 and the third quarter of 2008). The financial crisis had temporary effects on the chronic unemployment in these countries.
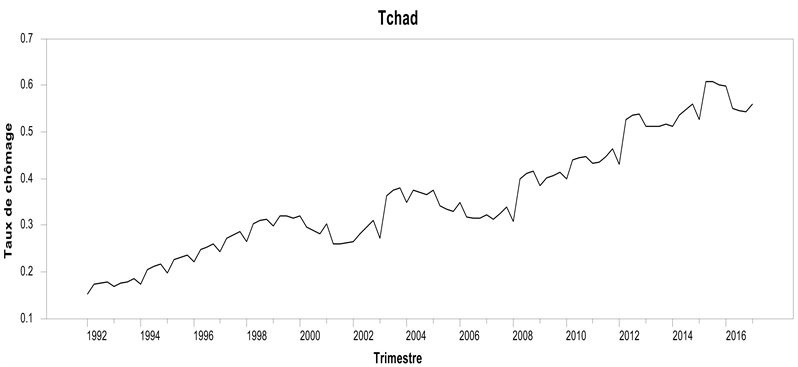
In Chad, the fourth quarter of 2011 and the third quarter of 2012 are the dates of major structural breaks in the unemployment rate series. These dates are linked to a significant drop in the unemployment rate, which fell from 11.9% (in 2003) to 5.7% (in 2011). This decline had permanent effects on Chad’s unemployment rate series.
Contrary to the findings of Krištić et al. (2018), Meng et al. (2017), and many others, the results of this research do not globally highlight persistent effects on the unemployment rate, that is, hysteresis, following the various shocks identified. Thus, these results are generally in agreement with those found by Papell et al. (2000), Lee et al. (2001), and others. In other words, the arguments of Blanchard & Summers (1986), who posit the presence of the hysteresis effect, are not borne out in the vast majority of ECCAS countries.
Njoda & Ulrich (2015), who consider the informal employment rate, conclude that the hysteresis hypothesis is only verified for two CEMAC countries, namely, Gabon and Republic of Congo. Additionally, in the context of South Africa, Pikoko & Andrew Phiri (2018) find that the hysteresis hypothesis is confirmed for the majority of unemployment categories, with the exception of unemployment associated with persons aged 55 - 64. Yaya, Ogbonna, & Mudida (2019), in turn, consider the majority of African countries and argue that the hysteresis hypothesis is verified in only 7 out of the 42 African countries.
The results of this work, which generally support the absence of unemployment hysteresis, like those of Yaya, Ogbonna & Mudida (2019), imply that with the exception of Gabon and Republic of Congo, shocks to unemployment are transitory and that strong conjunctural policy action is not necessary to meet the challenges of unemployment in all ECCAS countries. The results suggests, in general, a more rapid recovery of unemployment to prior levels following the various and multiple shocks.
2) Dynamics of the unemployment rate: a convergence factor in ECCAS
Like Krištić et al. (2018), Estrada et al. (2013), etc., who conclude that the unemployment rate is converging, the results of this research lead overall to a rejection of the hypothesis of stochastic divergence. In other words, there is stochastic convergence of the unemployment rate in all ECCAS countries. Based on the arguments of a number of authors ( Mundell, 1961;
Nonetheless, empirical evidence suggests a low degree of labor mobility in ECCAS countries, in contrast to the predictions above ( Mundell, 1961;
5. Conclusion and Implications for Economic Policies
The question of the dynamics of unemployment rates in regional blocs is a central concern for researchers and government authorities alike. Thus, in the context of ECCAS, this paper has pursued a twofold objective: namely, first, to identify the dates of potential structural breaks (or shocks), while verifying whether these shocks, notably CEMAC accession, generated permanent effects and, second, to test the hypothesis of stochastic divergence.
To achieve this, modern unit root tests with two breaks (LM and RALS-LM tests) were applied to the unemployment rate series of all ECCAS countries. The chronological data used for this purpose were transformed to quarterly frequency, i.e., 101 observations for each ECCAS country. The results of this work show that on the one hand, there is no overall presence of the hysteresis effect following the various shocks (or breaks) in the unemployment rate series in ECCAS countries (except Burundi, Cameroon and Chad). Additionally, accession to CEMAC had a significant but only transitory effect on the unemployment rate in Equatorial Guinea. On the other hand, the unemployment rate of each ECCAS country (except Angola, Central African Republic and Cameroon) converges towards the subregional reference level following a shock. The research hypothesis positing the presence of hysteresis and stochastic divergence within ECCAS is rejected.
In essence, these research results suggest that shocks to unemployment are transitory and that strong conjunctural policy action is not necessary to meet the unemployment challenges in all ECCAS countries. It is therefore desirable to modify the structure of unemployment through structural measures and encourage labor mobility.
Appendices
Appendix 1. List of countries in the Economic Community of Central African States (ECCAS)
Source: Authors
Appendix 2. Evolution of the unemployment rate in a sample of ECCAS countries (outside the monetary union), 199q1-2017q1


Appendix 3. Evolution of the unemployment rate in a sample of ECCAS countries (in monetary union), 1991-2017.

Appendix 4. Synthesis of the main empirical works used
Appendix 5. RATS codes that generated the results of different linear (ADF) and nonlinear unit root (LM and RALS-LM) tests on the unemployment rate series of the ECCAS countries, at quarterly frequency (199q1-2017q1)
We add the name of the series for each country after each code. For example, for Congo, we have the following:
@DFUNIT (DET = TREND, LAGS = 8) Unem_COG
@RALSLM_UROOT (model = 2, breaks = 2, transformation = 1, rals = 1, lags = 8, print = 0) Unem_COG
@LSUNIT (LAGS = 8, MODEL = BREAK, BREAKS = 2) Unem_COG
These codes were developed by Junsoo Lee for RALS-LM (see https://sites.google.com/site/junsoolee/codes).
Appendix 6. Principle of Goldstein and Kahn’s quarterly transformation method (1975)
Consider
and
, three (3) successive annual observations of variable X. If the quadratic function passing through these three points is such that:
(1)
(2)
(3)
then the parameters a, b and c can be determined by first calculating the integrals from (1) to (3) and then solving the following system of equations:
(4)
The resolution of this system leads to the following result:
(5)
From the values of the parameters of the quadratic function thus obtained, the four quarterly observations of year t can be calculated using the following interpolation formulas:
(6)
(7)
(8)
(9)
The algebraic calculations carried out on expressions (6) to (9) above, in which the parameters a, b and c have been previously replaced by their expressions of (5), finally lead to the following quarterly interpolation data:
(10)
(11)
(12)
(13)