Available Agricultural Area by Utilization Categories and Ownership Structure of Holdings in the Republic of Serbia ()
1. Introduction
Starting from the fact that the data on the structure of the agricultural holdings play a key role in the design, implementation and monitoring the agricultural policy of the European Union (EU), The Statistical Office of the Republic of Serbia (hereinafter: the Office) planned, organized and conducted the “Agricultural farms structure survey (hereinafter: the Survey) in 2018”1. The survey is a nationally significant, organizationally and programmatically very comprehensive activity of the Office in the field of agriculture. The obtained data will serve for the creation of the national agrarian policy, and for providing the basis for the functioning of the system of agricultural statistics. Applied instruments, coverage, features and standardization of concepts and definitions are in line with the recommendations of the World Programme for the census of Agriculture (UN-FAO), the European Parliament Regulations on conducting the Farm Structure Survey and Survey on Agricultural Production Method (Regulation [EC] No. 1166/2008 of the European Parliament and of the Council of 19. November 2008, on farm structure surveys and survey on agricultural production methods; Regulation [EC] No. 1200/2009, Regulation [EU] No. 715/2014), Eurostat methodology and valid domestic regulations (Law on the Census of Agriculture, “Official Gazette of RS” No. 104/09 and 24/11). Besides the agricultural census, the Survey is a key research that collects internationally comparable data on the funds and structure of agricultural holdings and is vital for socio-economic analysis and planning for further development in the field of agriculture.
The collected data refer to the land fund and utilization categories of agricultural area, irrigation, land cultivation and maintenance, agricultural mechanization, labor force and other activities of the holding that generate income, market orientation of agricultural production and other data on the holding. An important segment of the analysis of the collected data is the analysis of available agricultural land by categories of utilization and the ownership structure of holdings in the Republic of Serbia, in 2018. The results of such an analysis are intended for the wider scientific and professional public, with the desire to expand agro-economic and statistical analysis of the utilization, arrangement and protection of agricultural land in Serbia—especially by municipalities and areas. The presented results can be significant indicators by which the state and local government will be able to define the problems of agricultural activity more adequately and accordingly plan and make appropriate decisions and take appropriate measures for development, both at the local and state level [1].
2. Subject, Goal, Method and Significance of the Research
The collected data are the basis for updating the Statistical Register of Agricultural Holdings, which accuracy determines the quality of all statistical surveys that collect data on annual agricultural production, compile economic accounts in agriculture and typology of agricultural holdings [2]. In addition, the obtained results are useful to all other users of agricultural statistics data, i.e. agricultural faculties, institutes and the professional public.
The subject of research in this paper is the analysis and presentation of data on agricultural holdings, the structure of available and utilized area. The obtained data and calculated indicators represent:
1) overview of structural characteristics of national agriculture;
2) internationally comparable data, based on key features of agriculture; and
3) necessary statistical indicators needed to define improvement policy and agriculture development.
Main goal of this research is to determine and explain more comprehensively and in detail, and based on available databases, professional literature and legislation, using appropriate methods, the condition of utilized agricultural area (hereinafter: UAA) and its quantitative and qualitative characteristics—in total and by types of agricultural holdings (hereinafter: AHs)—family agricultural holdings (FAHs) and agricultural holdings of legal entities and entrepreneurs (AHLEEs), by statistical regions and lower statistical units of data grouping (districts and municipalities). The justification of such a defined goals stems from the knowledge that the current tendencies and the current situation in the management of agricultural area in general, and especially arable land and areas under orchards and vineyards [3], as production-significant utilization categories of agricultural area, are considered sporadically, without critical consideration of responsibility of their owners and/or users.
Implementation of such a defined basic research goal indicates necessity of more detailed and continuous study of the causes that led to the reduction of available agricultural land and especially its better and more important production categories of utilization [4]. UAA is a part of available land (AL), and this paper presents the state of AL of agricultural holdings in terms of utilization categories of agricultural holdings: agricultural (utilized UAA and unutilized NUAA), woodland and other land.
The importance of this analysis stems from the possibility to point out to the scientific and professional public, competent state institutions, owners and/or users of agricultural area, the need to utilize, arrange and protect agricultural area in Serbia in accordance with the principle of sustainability, which reads: “Generation of current users is obliged to use the agricultural area taken over from their ancestors and to leave it, if not in an increased area and in an improved condition, then at least in the taken over area and in the current condition, to the next generation of users for their sustainable development!” [5].
The significance of this research stems from the fact that the results of the analysis of utilized agricultural area can be used to adopt appropriate measures and undertake certain activities in land and overall agricultural and rural policy [6] related to sustainable use, arrangement and protection of agricultural area and more even integrated development of rural areas [7], as well as to find better solutions in the field of utilization, ownership sector and conditions of agricultural land management.
3. Structure of Agricultural Holdings
The starting point and backbone of all the observed parameters is precisely the structure of agricultural holdings AHs in Serbia. The results show that there were a total of 564,542 AHs in Serbia in 2018, of which 562,895 were family agricultural holdings (FAHs), only 1375 agricultural holdings of legal entities (AHLEs) and 272 agricultural holdings of entrepreneurs (AHEs). It can be concluded that the total number of agricultural holdings is dominated by FAHs (99.71%) (see Table 1 and Graph 1).
AHLEEs are minor in number (only 0.24% and 0.05%), but this group has a significant share in UAA and a large average area of property, so it can be concluded that they are significant production and economic entities in Serbian agriculture. However, at the same time, their participation in the NUAA is relatively large.
Regionally, the largest number of FAHs is in the region of Šumadija and Western Serbia (42.97%). This region has the largest number of agricultural holdings of entrepreneurs AHEs (41.2%), while the largest number of AHLEs is in the Region of Vojvodina (56.0%) (see Table 2 and Graph 2).
![]()
Table 1. Basic indicators on the number and size of AH in the Republic of Serbia, 2018.
Source: author’s calculation based on data of the Statistical Office of the Republic of Serbia.

Source: Table 1.
Graph 1. Basic indicators on the number and size of AHs in the Republic of Serbia, 2018.
![]()
Table 2. Agricultural holdings with the status of legal entity, by regions.
Source: author’s calculation based on the Statistical Office of the Republic of Serbia data.

Source: Table 2.
Graph 2. (a) Share of FAHs by regions in the total number of FAHs in the Republic of Serbia (%); (b) Share of AHLEEs by regions in the total number.
4. Available Land per Utilisation Categories Area
The total available land AL is the area of—utilized agricultural, unutilized agricultural, woodland and other land, expressed in ha for each household that owns the land, whether it uses it or not and whether the household has a holding (The Statistical Office of the Republic of Serbia 2018). Agricultural land includes UAA and NUAA in the agricultural year 2018.
1) Utilized agricultural area (UAA) is a land used for growing crops and consists of: agricultural area in the yard, arable land and gardens, perennial plantations—orchards, vineyards, plant nurseries, as well as meadows and pastures that the holdings cultivates/utilizes in agricultural year 2018.
2) Unutilized agricultural area (NUAA) represents the agricultural area that the holding had at its disposal on the day of the critical moment, but was not used in the observed agricultural year for economic, social or other reasons (e.g. flooded area). This area can be returned to the cultivation process by using the resources available to the holding or by leasing it.
3) Woodland area is an area overgrown with forest trees and shrubs, including poplar plantations inside or outside the woodland, forest tree nurseries for the holding’s own needs within woodlands, buffer zones, as well as forest infrastructure (roads, timber warehouses, etc.). Woodland area also includes forest tree nurseries within the woodland for the holding’s own needs, forest facilities, roads, areas under windbreaks and barren lands within the woodland.
4) Other land means holding’s land under buildings, roads, yards, gardens and lawns, ponds, reeds, swamps, rocky areas, infertile areas, inland dunes and other areas unsuitable for agricultural production.
Available land AL—represents the sum of UAA, NUAA, woodland areas and other land in total.
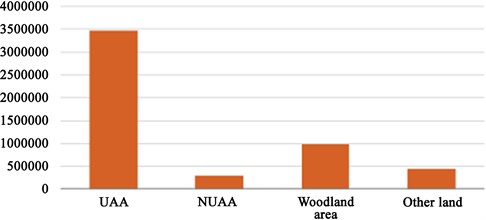
The structure of available land per utilization categories in Serbia is strongly dominated by UAA (67.12%) – which makes a total of 72.2% of available agricultural land together with NUAA (5.60%). It is followed by woodland (18.77%) and other land (8.51%) (Table 3, Graph 3). If we take into account the significant differences in the categories of available land by region, it is desirable to look at this structure of the UAA and NUAA and by districts.
Differences in the representation of the UAA in certain regions range from only 58.44% in the Region of Southern and Eastern Serbia to 79.39% in the Region of Vojvodina. Significant differences in the representation of NUAA are evident, ranging between 11.11% in the Region of Southern and Eastern Serbia to 3.26% in the Region of Vojvodina. The differences are even greater at the district level. NUAA ranges from 1.17% (Srem District) to 22.78% (Pirot District). Thus, the share of UAA by regions is between only 58.44% in the Region of Southern and Eastern Serbia (where landowners left their properties in large numbers) to as many as 79.39% in the Region of Vojvodina, which is the richest region in Serbia in terms of AL and benefits for agricultural production [8].
![]()
Table 3. Available land per utilization categories in the Republic of Serbia, 2018.
Source: author’s calculation based on data of the Statistical Office of the Republic of Serbia
Source: Table 3.
Graph 3. Available land per utilization categories in the Republic of Serbia, 2018 (ha).
There are also significant regional differences in the representation of woodland by districts [9]. Areas covered by woodland comprise 18.77% of the total AL in the Republic of Serbia. At the level of the defined areas, the share of areas covered by woodland in the total AL ranges from 0.07% (North Banat District) to 39.58% (Zlatibor District). However, in relation to the above-mentioned average indicators for Serbia, regional differences in the structure of AL by utilisation categories point to the following statements:
First, the dominant share of the UAA in the total AL is characteristic for all four statistical regions, with the representation of the UAA in Vojvodina Region being significantly above (79.39%), and in all three regions in central Serbia the representation is relatively uniformed and significantly below the national average and ranges from 55.26% in the Belgrade region, 60.93% in the Region of Šumadija and Western Serbia and 58.44% in the Region of Southern and Eastern Serbia;
Second, the difference between the total AL and UAA indicates a significant representation of one or two of the three individual utilisation categories, namely:
· Other land comprises approximately one third of available land in Belgrade region (28.41%);
· Other land is significantly represented in the structure of the AL of the Region of Vojvodina (10.92%);
· Woodland area comprises 30.55% of AL of Šumadija and Pomoravlje;
· Cumulatively shown categories of woodland (23.91%) and NUAA (23.91%), comprise about one third of the available land in the Region of Southern and Eastern Serbia (Table 4 and Graph 4).
![]()
Table 4. Available land per districts in the Republic of Serbia, 2018.
Source: author’s calculation based on data of the Statistical Office of the Republic of Serbia.

Source: Table 4.
Graph 4. Structure of AL utilization in the Republic of Serbia and by regions, 2018 (%).
5. Ownership Structure of UAA and NUAA According to the Legal Status of Holdings
A significant aspect of the analysis of AL by utilisation categories is also the analysis of the relationship between UAA and NUAA by the legal status of holdings [10]. The ownership structure of AHs presented in this part of the paper contains the results of the analysis for two basic forms of holding organization (FAHs and AHLEEs) in Serbia and by regions (see Table 5 and Table 6).
The majority of AL belongs to FAHs (73.58%), and 26.42% to AHLEEs. However, the share of FAHs in utilized area is 83.90%, and AHLEEs only 16.10%. The share of FAHs in NUAA is 35.80%, and AHLEEs even 64.20%. FAHs also has a dominant share in the category of woodland area (72.57%), and AHLEEs owns only 27.43% of woodland.
In the structure of the total AL of all AHs, UAA dominates (67.12%), but NUAA (5.60%) is also relatively significantly represented. The total area of NUAA is 289,953 ha. Utilized agricultural area of the total available FAHs land is 76.53%, and unutilized is 2.72%. However, the utilized area of AHLEEs is only 40.91%, and the unutilized area is 13.61% of the available land of this group of holdings.
It can be concluded that:
1) The majority of available land belongs to FAHs (73.58%), and 26.42% to AHLEEs;
2) The share of FAHs in UAA is 83.90%, and AHLEEs is only 16.10%;
3) The share of FAHs in NUAA is 35.80%, and AHLEEs even 64.20%;
4) FAHs also has a dominant share in the category of woodland area (72.57%), and only 27.43% is woodland area of AHLEEs.
If we take into account the size of AHLEEs property and their large share in the total AL, the following can be concluded:
1) The average size of AH property in Serbia is only 6.22 ha/AH UAA. The regional analysis of this indicator points out that only holdings in the Region of Vojvodina are with an above-average area of property (12.71 ha/AH or 2.04 times higher)—which is the result of the concentration of the largest number by area of significantly larger AHLEEs. In contrast, holdings properties in all three other regions are lower than the national average: 4.89 ha/AH in the Belgrade region, 4.28 ha/AH in the Šumadija and Western Serbia Region and 4.40 ha/AH in the Southern and Eastern Serbia Region.
2) Legal entities and entrepreneurs comprise only 0.29% of the total number of AHs, but they have 26.42% of the total AHs at their disposal; their share in UAA is 16.10%, and in NUAA 64.20%.
3) AHLEEs are relatively few (1647), but have a significant average size of property of 364.2 ha of utilised and even 479.74 ha of NUAA and 779.87 ha of woodland.
![]()
Table 5. AL by utilization categories and legal status of holdings in the Republic of Serbia, 2018.
Source: author’s calculation based on data of the Statistical Office of the Republic of Serbia.
![]()
Table 6. Available land by utilization categories and legal status of holdings.
Source: author’s calculation based on data of the Statistical Office of the Republic of Serbia.
AHLEEs have at their disposal even 186,138 ha or 64.20% of the total NUAA in Serbia, which indicates the need for a detailed analysis of the management of agricultural land owned and utilised by this group of entities [11].
6. Analysis of the Ownership Structure According to the Legal Status of Holdings and the Size of Property
The results show that there are significant differences between the three ownership subgroups of all holdings, and they are reflected in the large disproportion of their representation in the total number of holdings and the total area of the UAA. From this point of view, all AHs can be classified into three relatively homogeneous groups of holdings by size of the property: small (“less than 5 ha”), medium (“5 - 20 ha”) and large (“more than 20 ha”). The analysis of the ownership structure according to the share of the defined three collective groups of AHs indicates certain characteristics, as follows:
· AHs with smaller property is a group in which the dominant part is concentrated, even 71.74% of the total number of AH in Serbia, and they utilise only 23.24% of the total UAA;
· AHs with medium size of property and comprise 24.29% of the total number of AHs, and utilise 35.14% of the total UAA;
· AHs with larger property comprise 3.96% of the total number of holdings, and utilise 41.62% of the total UAA.
6.1. Regional Analysis of the Ownership Structure of FAHs
Regional analysis of the ownership structure of FAHs indicates significant differences in the ownership structure in four statistical regions in Serbia, which are reflected in the following statements (Table 7 and Graph 5):
Belgrade region is the least represented in the number of holdings (5.32%) and in the UAA of all FAHs in Serbia (only 4.08%);
The region of Vojvodina is in third place in terms of representation in number of FAHs (22.42%), but it is the most represented in the total utilized agricultural area FAHs (40.07%)—which makes it the most important agricultural region in Serbia in terms of production.
![]()
Table 7. Ownership structure of FAHs in the Republic of Serbia by regions.
Source: author’s calculation based on data of the Statistical Office of the Republic of Serbia.
Source: Table 7.
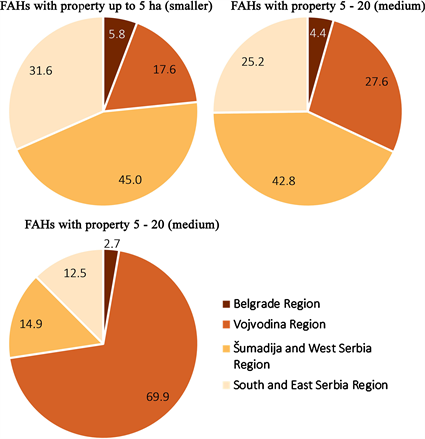
Graph 5. Ownership structure of FAHs by regions (%).
The region of Šumadija and Western Serbia is the most represented in the total number of FAHs (43.03%), but it is in second place in terms of the total utilized agricultural area of FAHs in Serbia (33.79%);
The region of Southern and Eastern Serbia is in second place in terms of share in the number of FAHs (29.23%), and in third place in terms of share in the total utilized agricultural area of FAHs in Serbia (22.07%).
In the Belgrade region, the most represented is the collective group of small holdings (77.03% of FAHs of this region and 37.97% of UAA), followed by medium holdings (20.15% of FAHs and 43.10% of UAA), while large holdings are the least represented (1.94% of FAHs and 18.93% of UAA). There are 265 FAHs without land in this region;
In the Region of Vojvodina, small holdings are dominant in number, but with the least UAA (55.58% of FAHs of this region and 10.45% of UAA of the region), while medium holdings are in a position that corresponds to their name (29.96% of FAHs and 32.77% of UAA). A small group of large FAHs (11.97% of FAHs) dominate in UAA (56.78% of FAHs of this region). Without land in this region is 2.48% or 3128 of FAHs;
In the region of Šumadija and Western Serbia, small holdings are dominant in number and significant in UAA (74.20% of FAHs of this region and 39.25% of UAA), medium holdings are significant in number and more significant in utilized land (24.16% FAHs and 50.24% UAA), and large holdings are the least represented by both indicators that determine the ownership structure (1.33% of FAHs and 10.51% of UAA). Without land in this region is 0.31% or 740 FAHs;
In the Region of Southern and Eastern Serbia, small holdings comprise 76.78% of the total number of FAHs and have 39.32% of UAA at their disposal, medium holdings comprise 20.94% of FAHs and have 44.91% of UAA at their disposal, while large holdings comprise the remaining 1.64% of FAHs and have at their disposal 15.77% of UAA. Without land in this region is 0.64% or 1047 FAHs.
The largest share of FAHs without land is in the Region of Vojvodina (2.48%), and the lowest in the Region of Šumadija and Western Serbia (0.31%).
FAHs larger than 20 ha are dominant in the Region of Vojvodina (69.91% of the total number of holdings of this size in the Republic of Serbia) and utilize 74.46% of land in the group of larger properties (holdings with property over 20 ha). Representation of FAHs larger than 20 ha in the Belgrade region is 2.68%, in the region of Šumadija and Western Serbia 14.91%, and in the region of Southern and Eastern Serbia 12.49% of the holdings of this group.
The largest part of FAHs with a holding of up to 5 ha and FAHs with a holding of medium size (5 - 20 ha) is in the Region of Šumadija and Western Serbia (over 45%). In the Region of Southern and Eastern Serbia, FAHs with a property of up to 5 ha (31.64%) are dominant, and holdings with a property of over 20 ha have almost negligible share in the total number of FAHs.
The general conclusions of the regional analysis of the ownership structure between collective groups of FAHs in Serbia are:
1) small holdings (“up to 5 ha”) are dominant in the total number of FAHs in all four statistical regions (between 55.58% in the Region of Vojvodina and 77.03% in the Belgrade region), and are in second place in terms of representation in total UAA in all regions (37.97% in the Belgrade region and 39.32% in the Region of Southern and Eastern Serbia), while in the region of Šumadija and Western Serbia this group of FAHs utilize 39.25% of the total UAA of the region, and in the Region of Vojvodina have the lowest share in the UAA (10.45%);
2) large holdings (“over 20 ha”) are the least represented in the total number of FAHs in all four regions (between 1.33% in the Region of Šumadija and Western Serbia to 11.97% in the Region of Vojvodina); they are least represented in the UAA in three regions (between 10.51% in the region of Šumadija and Western Serbia and 18.93% in the Belgrade region), while in the region of Vojvodina they are the dominant group in the UAA—they utilize 56.78% of the UAA region.
3) medium holdings (“5 - 20 ha”) are between small and large holdings in terms of representation in the number of FAHs in all four regions (between 20.15% in the Belgrade region and 29.97% in the Vojvodina region); representation in the UAA is 32.77% in the Region of Vojvodina and 44.91% in the Region of Southern and Eastern Serbia, and in the Region of Šumadija and Western Serbia they are the most represented, with 50.24% of the UAA.
6.2. Regional Analysis of AHLEEs Ownership Structure
In the AHLEEs group, there are only 1647 holdings or 0.29% of the total of 564,542 agricultural holdings, which had 559,769 ha or 16.10% of the total UAA in Serbia at their disposal. The basic characteristics of the representation of AHLEEs in the total number of holdings and in the total area of the UAA of all AHs in Serbia in 2018 are:
· Relatively large representation of holdings “without land”—6.62%;
· Holdings with larger property (over 20 ha) are the most represented and comprise 46.99% of the total number of AHLEEs, and have at their disposal 99.27% of the total UAA of all AHLEEs;
· Differences in the average area of the UAA per household are expressed.
The distribution of AHLEEs and their UAA by regions in Serbia points to the following observation:
The region of Vojvodina is the most represented in terms of the number of holdings (883 holdings or 53.61% of AHLEEs) and dominant in the UAA of this group of holdings (405,938 ha or even 72.52% of the UAA of AHLEEs);
The region of Šumadija and Western Serbia is in the second place in terms of representation in the number of holdings (412 holdings or 25.01% of AHLEEs), but also in the third place in terms of UAA of this group of holdings (50 697 ha or 9.05% of UAA of AHLEEs);
The region of Southern and Eastern Serbia is in the third place in terms of representation in the number of holdings (269 holdings or 16.33% of AHLEEs), but also in better second place in terms of UAA of this group of holdings (76,472 ha or 13.66% of UAA of AHLEEs);
The Belgrade region is the least represented, with only 83 holdings or 5.04% of AHLEEs, and has at its disposal 26,661 ha or 4.76% of the total UAA of AHLEEs (Table 8 and Graph 6).
Without land is 109 AHLEEs of the total listed AHLEEs (1647) or 6.62%, which is a significant percentage in relation to the total number of AHs (in the Region of Southern and Eastern Serbia 20.01%, and in the Region of Šumadija and Western Serbia 33.94% of the total number of AHLEEs without land). In all regions, AHLEEs with a property of more than 20 ha utilize the largest part of the land available to this group of holdings.
The analysis of the ownership structure of the AHLEEs in four statistical regions in Serbia, according to the representation of three collective groups of holdings with a certain size of property, indicates the following regional differences:
Small holdings dominate in the total number of holdings, and are minor in the total UAA holdings of legal entities and entrepreneurs in three regions: Belgrade (32.53% of AHLEEs of this region and 0.21% of UAA of AHLEEs), in the Region of Šumadija and Western Serbia (48.23% of AHLEEs of this region and 0.70% of UAA of AHLEEs of the region) and Southern and Eastern Serbia (31.82% of AHLEEs and 0.20% of UAA of AHLEEs), while in the Region of Vojvodina the representation is in the number of holdings (17.10% of AHLEEs), and the least represented are in UAA (0.07% of UAA of AHLEEs of this region);
![]()
Table 8. Ownership structure of AHLEEs in the Republic of Serbia by regions.
Source: author’s calculation based on data of the Statistical Office of the Republic of Serbia.
Source: Table 8.
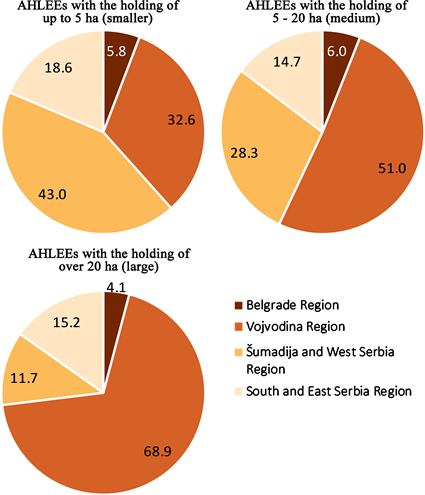
Graph 6. Ownership structure of AHLEEs by regions (%).
Large holdings dominate in the total of UAA and are differently represented in the total number of AHLEEs in all four statistical regions: in the Belgrade region this group makes 38.55% of AHLEEs region and 99.05% of UAA of AHLEE of this region, in Vojvodina this group is 60.48% of AHLEEs and 99.52% of UAA of AHLEEs region, in Šumadija and Western Serbia they comprise 22.05% of AHLEEs and 97.60% of UAA of AHLEEs, and in Southern and Eastern Serbia 44.01% of AHLEEs and 99.17% of UAA of AHLEEs of this region;
Medium holdings are relatively more represented in the total number, and minor in the total of UAA of AHLEEs in all four statistical regions: in the Belgrade region this group of holdings comprises 21.69% of AHLEEs and utilizes 0.74% of UAA of AHLEEs of this region; in the Region of Vojvodina 17.33% are AHLEEs and utilize 0.42% of UAA of AHLEEs of this region; in the region of Šumadija and Western Serbia 20.69% of AHLEEs is this group of holdings and they utilize 1.70% of UAA of AHLEEs of this region, in the Region of Southern and Eastern Serbia this group comprises 16.22% of AHLEEs and utilizes 0.63% of UAA of AHLEEs of this region.
6.3. Review of the Results of the Ownership Structure of Agricultural Holdings Analysis
The analysis of the ownership structure of all AHs according to the legal status of holdings in Serbia indicates that (Table 9):
1) AHs with smaller property (up to 5 ha) comprise even 71.74% of the total number of AHs, and utilize only 23.24% of the UAA.
2) AHs with medium size of property (5 - 20 ha) cover 24.29% of AHs, and utilize 35.14% of UAA.
3) AHs with larger property (“over 20 ha”) and comprise 3.96% of the total number of AHs, and utilize 41.62% of UAA.
FAHs are dominant in the total number of holdings (99.71%) and, at a slightly lower level, in the total number of UAA (83.84%).
· FAHs with smaller property are dominant in the total number of FAHs in all four statistical regions: 70.95% of the total number of FAHs, and their share in the UAA is only 27.67%. This result suggests a large fragmentation of FAHs properties.
· FAHs with a medium size of property comprise 24.31% of the total number of FAHs, and the share in UAA is 41.77%. The largest part of FAHs with medium-sized property is in the Region of Šumadija and Western Serbia (over 45%).
· FAHs with larger property comprise only 3.84% of FAHs, and their share in UAA is 30.57%. So the number of large FAHs is small, but they utilize one third of the FAHs land. Large holdings are the least represented in the total number of FAHs in all four regions; in the Region of Vojvodina and the dominant group in the UAA, utilize 56.78% of the UAA region.
AHLEEs represent, by number, a small group (only 1,647 households or 0.29% of the total number of AHs), but have a significantly higher share in UAA (16.10%).
· AHLEEs with smaller property comprise 28.71% of the total number of holdings in this group, and their share in UAA is only 0.15% (excluding land 6.67%). These holdings dominate in the number of AHLEEs, and are minor in the total UAA of AHLEEs holdings in three regions;
· AHLEEs with a medium size of holdings comprise 18.21%, and their share in the UAA is only 0.58%;
![]()
Table 9. Regional analysis of the ownership structure of FAHs collective groups in Serbia.
Source: author’s calculation based on data of the Statistical Office of the Republic of Serbia.
· AHLEEs with larger holdings comprise 47%, and their share in the UAA is even 99%. However, in the category of holdings larger than 100 ha it is 29.57% of the total number of AHLEEs and they utilize 96.76% of the land of this group of holdings. Large holdings dominate in the total of UAA and are differently represented in the total number of AHLEEs in regions.
The analysis of the ownership structure of all AHs according to the legal status of holdings in Serbia indicates that:
FAHs is dominant in the total number of holdings (99.71%) and, at a slightly lower level, in the total UAA (83.84%). In the group of holdings with smaller property, FAHs occupy 70.95% of the total number of FAHs, and their share in UAA is only 27.67%. This result suggests a large fragmentation of FAHs properties. In the group of holdings with medium size of property, there are 24.31% of the total number of FAHs, and their share in the UAA of FAHs is 41.77%. In the group of holdings with larger property, only 3.84% are FAHs, and their share in the UAA of this group of holdings is 30.57%. So the number of large FAHs is small, but they utlize one third of the FAHs land;
AHLEEs by number represent a small group of holdings (only 1,647 households or 0.29% of the total number of AHs), but have a significantly higher share in the total UAA (16.10%) and are the dominant category by number of holdings and UAA in two groups of holdings with larger properties (over 20 ha and over 100 ha). In the group of holdings with smaller properties, AHLEEs comprise 0.12% of the total number of holdings in this group, and their share in UAA is only 0.11%. In the group of holdings with medium-sized property, AHLEEs comprise 0.22%, and their share in UAA in this group is only 0.26%. In the group of holdings with larger property, AHLEEs comprise 3.58%, and their share in UAA is as high as 38.41%. However, in the category of properties larger than 100 ha there is 29.57% of the total number of AHLEEs and they utilize 96.76% of the land of this group of holdings.
AHLEEs are relatively small (1647), but have a significant average size of property, an average of 364 ha of utilized property and even 479 ha of NUAA;
![]()
Table 10. Regional analysis of the ownership structure of AHLEEs in Serbia, 2018.
Source: author’s calculation based on data of the Statistical Office of the Republic of Serbia.
779 ha of woodland. AHLEEs have at their disposal even 186,138 ha or 64.20% of the total NUAA in Serbia, which indicates the need for a detailed analysis of agricultural land management in this group of entities (Table 10).
7. Conclusions
The aim of this paper represents a realistic view of economic strength and type of agricultural production on holdings in Serbia, in order to obtain a quality, analytical and comparable basis for analysis of structural characteristics and economic parameters of AHs and conceptualization of agricultural policy measures, but also for comparative analysis with AHs in EU countries and neighboring countries [12], as well as a base for scientists in further scientific research on the structural characteristics and economic performance of agricultural holdings in Serbia. Systematization of data and analysis of the obtained results led to a number of important conclusions about this segment of agriculture in the Republic of Serbia. Some of the basic conclusions can be singled out in a brief review of the overall results obtained.
According to the obtained results in the Republic of Serbia in 2018, there are 564,542 agricultural holdings, 562,895 family agricultural holdings, 1375 agricultural holdings of legal entities and 272 agricultural holdings of entrepreneurs. It can be concluded that the total number of holdings is dominated by family holdings (99.71%). The largest part of the total number of FAHs is in the region of Šumadija and Western Serbia (about 43%), and the smallest is in the region of Vojvodina (5.32%). AHLEEs are minor in number (only 0.29%), but this group has a significant share in the UAA and a large average area of property, so it can be concluded that they are important production and economic entities in Serbian agriculture.
The area of available land in the Republic of Serbia in 2018 is 5,178,692 ha, of which the largest part is in the Region of Vojvodina (38.29%) and in the Region of Šumadija and Western Serbia (32.83%), and the smallest in the Belgrade region, only 5.09%. Agricultural land comprises 72.72% of the total available land, and 18.77% is woodland (972,283 ha). UAA comprises 3,475,894 ha of the total agricultural land, and 289,953 ha is NUAA (5.6%).
It can be concluded that Serbian agriculture is characterized by a dominant number of FAHs in relation to the AHLEEs. The average size of property is small (6.22 ha/AH; 5.23 ha/FAH and 364.2 ha/AHLEE—Table 6). The FAHs category is dominated by FAHs with a property of less than 5 ha, and in the AHLEEs category the most represented are entities with a property of more than 20 ha. This ownership group uses the largest part of the land in all observed regions.
There is an obvious contrast between the smallest and the largest ownership group of holdings and their representation in the total number of agricultural holdings AHs and in the total area UAA.
NOTES
1The survey was conducted on a sample that included 121,070 agricultural holdings. It was funded from the budget of the Republic of Serbia and from the pre-accession funds of the European Union, within the IPA 2016 project (Instrument for Pre-accession Assistance, 2016).