Evaluating Nitrogen Behavior in Sugarcane after Fertilization Using Leaf and Sap Extract Analyzes ()
1. Introduction
Nitrogen (N), along with potassium (K), is the most accumulated nutrient in sugarcane fields. N is an essential element for crop production, and in sugarcane its uptake varies from 100 to 300 kg∙ha−1, to achieve stalk yields of around 100 t∙ha−1 [1] . The use of N fertilizers is a key component of the energetic and environmental balance of sugarcane for biofuel production. Nitrogen fertilization sugarcane is responsible for 23% of the total fossil energy in farm operations, and 19% of total energy consumption, taking into consideration bioethanol production [2] . Therefore, it is important to ensure the most appropriate use of N fertilizers in order to improve the sustainability of sugarcane production.
The amount of N fertilizer added to sugarcane in Brazil is lower than in other countries [1] . However, the response of sugarcane to N fertilization in Brazil is typically erratic, and a positive response is more frequently observed in ratoons (regrowth of planted cane) compared to plant cane, with low use of N from fertilizer. Franco, Otto [3] evaluated the recovery of 15N and demonstrated that sugarcane absorbs around 40% of N from fertilizer in ratoon cycle and 5% in plant cane cycle.
The low values and uneven efficiency in the use of N by sugarcane are associated with the residual effects of fertilizer in the soil and its elevated immobilization [4] , in addition to other losses of N. However, immobilized N can remain in the soil in organic forms. Dourado-Neto, Powlson [5] studied 15N recovery in 13 diverse tropical agroecosystems in nine different countries, observing that organic matter (OM) was the main source of N in agricultural production and, on average, soil OM provides around 79% of N found in plants.
In order to make better use of N fertilizer in sugarcane production, to enhance the efficiency of its use by the plants, it is important to know the times of high uptake and the preferred forms for N absorption. According to [6] , the highest uptake of N occurs during the initial development stages, typically within 90 days of fertilization, before full development of the canopy. Thus, leaf analysis performed after canopy closure may not represent the positive responses of N fertilization in the crop yield [7] [8] .
Adequate monitoring of crop nutrition in the initial stages of development may enable changes to be made to fertilizer management, as well as decisions to be made regarding parceling of nitrogen fertilization, particularly in low clay content soils. The use of sap analysis may be a suitable alternative to evaluate N status within sugarcane crops. The extraction of the liquid from the plant cell tissues, generically called sap extract, and its quantification in terms of nutrients has been successfully adopted for fertilizer management of horticultural and perennial fruit trees, such as citrus trees, in Brazil [9] [10] .
Therefore, the aim of this study was to evaluate N behavior in sugarcane under different N fertilizer application rates at two sites and five sampling times, seeking to assess the suitability of sap analysis for the management of N fertilizer application in sugarcane production.
2. Methods
This study was carried out in two experimental areas located in the municipalities of Jau and Piracicaba, in São Paulo state, which accounts for more than 50% of Brazilian sugarcane production. The experimental area of Jau is located in the mid-west region of the state (22˚15'10.25"S; 48˚3'6.26"W; 522 m above sea level), in a Humic Hapludox soil. The experimental area of Piracicaba is located in the central-south region of the state (22˚41'10.15"S; 47˚38'54.7"W; 547 m above sea level), in a Typic Plinthudults soil. In both areas, the trials were established in 2010, when the sugarcane was planted. After the plant cane harvest, in August and September 2011, and the ratoon cane harvest, in 2012, the second ratoon was evaluated in this study. In both experiments, sugarcane cv SP81-3250 was planted. Soil samples were collected in 2010, before sugarcane planting, and information about soil conditions at the beginning of the experiment is presented in Table1 Climate conditions (rainfall and temperatures) are shown in Figure 1.
A randomized complete block design was used, with four replications and four treatments: 0, 50, 100, and 150 kg∙ha−1 of N, in ammonium nitrate form. Experimental plots consisted of five rows each 10 m long in Piracicaba (75 m2) and five rows each 8 m long in Jau (60 m2). The rows were spaced 1.5 m apart in both locations. The N application rates were defined based on a recommendation to the state of Sao Paulo of 100 kg∙ha−1 of N for ratoon cane [11] . The sugarcane was also fertilized with P (50 kg∙ha−1 P2O5) as triple superphosphate, and K (150 kg∙ha−1 K2O) as potassium chloride. The fertilizer was applied following the first rain after the ratoon harvest, when the sugarcane had started to regrow. The dates of fertilization were September 25th, 2012 (Piracicaba) and October 15th, 2012 (Jau).
Following N fertilization, leaves were sampled for sap and tissue analysis. In order to avoid destroying small plants, and to determine the behavior of N in the plants, the first sampling took place 15 days after fertilization

Table 1 . Soil fertility characterization of sugarcane field experiments1.
1Soil analysis was performed according to methods described in Raij et al. (2011).
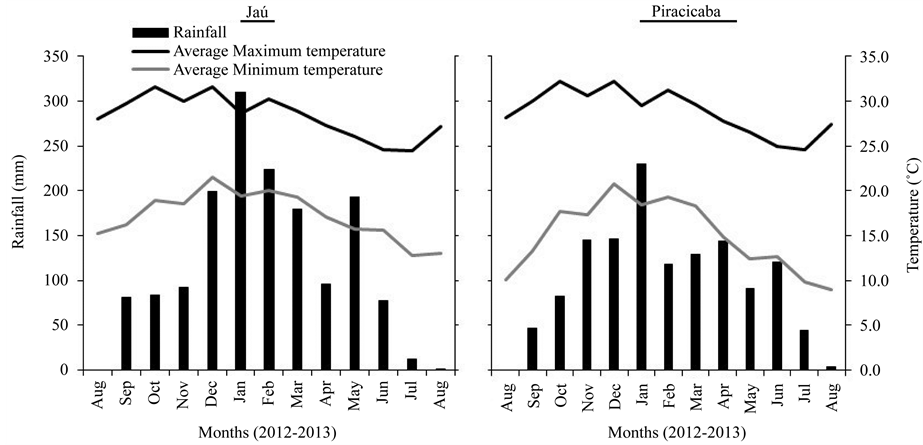
Figure 1. Monthly rainfall, and maximum and minimum temperatures in Jau and Piracicaba, São Paulo state.
in Piracicaba and 30 days after fertilization in Jau. In Piracicaba, leaves were also sampled at 40, 70, 120, and 150 days after fertilization, and in Jau, they were sampled at 60, 90, 120, and 150 days after fertilization. The difference between the initial sampling times at the two experimental locations was due to a delay in the initial development of the plants in Jau, meaning these plants were not suitable for sampling 15 days after fertilization. After 150 days, the plants were too mature for sufficient amounts of sap to be extracted for analysis. An excessive number of leaves would need to be sampled from mature plants to enable sap analysis, which would have jeopardized plant development and yield from the plots. In typical sugarcane situations, 150 days after fertilization, the sugarcane canopy is tall and practically closed, preventing changes to fertilizer management.
At each sampling time, the least-developed leaves were chosen, as these structures have a higher nutrient flux, particularly during the initial stages of plant development. In addition, old leaves have insufficient sap, making it more difficult to extract sap under laboratory conditions. The midrib was extracted from the chosen leaves for sap analysis, and the middle third of the leaf blade was also extracted in order to analyze total N in the leaf tissue.
In order to obtain the sap extract as described by Cadahía and Lucena [12] , and adapted by Souza, Bôas [10] , 30 young leaves were sampled per plot in the morning. Leaves were placed in paper bags and transported to the laboratory inside thermal boxes containing ice bags. The midribs were separated from the leaf blades, cleaned with cheesecloth soaked in distilled water, dried on paper towels, cut into 1- to 2-cm fractions, and placed into 250-mL plastic flasks. Sufficient ethyl ether (analytical grade) was added to the flasks to cover completely the midrib fractions, ensuring complete sap extraction. Since the extraction is performed using fresh material, the flasks containing the midribs and the ethyl ether were frozen (−15˚C for 4 - 7 days) on the day of sampling. Samples were then thawed, and the sap extract (formed by a mixture of xylem, phloem, and cellular soluble minerals) was separated from the ethyl ether using a separator funnel. The middle third of the leaf blades extracted for total N analysis were cleaned, dried at 65˚C and ground according to Bataglia, Furlani [13] .
The concentration of inorganic forms of N ( and
and ) in the sap extracts were determined by distillation (Kjeldahl method) and the total N concentration in both leaf and sap extracts was determined using sulfuric digestion and distillation [13] .
Soil samples were collected a few days prior to leaf sampling (13, 40, 70, 114, and 134 days after fertilization in Piracicaba; 30, 58, 86, 123, and 151 days after fertilization in Jau), from a depth of 0 - 10 cm, next to the sugarcane rows, and from 15 locations inside the plots. The samples were placed in plastic bags and transported to the laboratory inside thermal boxes with ice bags, where the mineral N ions were extracted using KCl 0.01 mol∙L−1. Subsequently,  and
and  content was determined by distillation, according to Raij, Andrade [14] . Small portions of soil samples were separated to determine the water content, by weighing before and after drying at 105˚C.
In February 2013, during the major growth period of the sugarcane, the top visible dewlap (TVD) leaf was collected from 30 plants within each plot in both trials. The midrib from each leaf blade was removed and the middle third of the leaf blade was retained for analysis. Similar to the process undertaken for the leaf blades of young leaves, the TVD samples were oven dried at 105˚C, ground and the total N content was determined using sulfuric digestion and distillation, according to the methods described by Bataglia, Furlani [13] . At the end of the growth cycle, plants were harvested in order to determine the stalk yield. The total plot area was harvested manually, and the stalks were weighed to provide an estimate of the crop yield in tons per ha.
The data were analyzed using analysis of variance tests (F test) with 5% and 1% significance levels, and linear and polynomial regressions, using the statistical program SISVAR [15] .
3. Results and Discussion
Soil moisture differed between locations, with higher values of water-filled pore space (WFPS) observed in Piracicaba (Figure 2). Even under similar rainfall conditions (Figure 1), the soil moisture results were mainly affected by the soil clay content, with higher moisture in the clayey soil of Piracicaba, compared to the mediumtextured soil of Jau. In both locations, the soil moisture was directly related to the rainfall that occurred during the sampling periods.
During the initial stages of the experiment, the soil nitrate and ammonium contents were significantly higher in Piracicaba than in Jau. However, even with an increase in soil moisture at 120 and 150 days after fertilization, the mineral N content of the soil in Piracicaba was low, similar to that observed in Jau. In Jau, the mineral N content of soil remained low, even in the initial stages of the experiment, 30 days after fertilization. The movement of mineral N from fertilizer in the soil is driven by several factors, such as nutrient concentration in the soil solution, soil adsorption capacity, soil pH [16] , fertilizer solubility [17] , soil water content, macroporosity and crop uptake [18] . High mineral N concentrations in the top layer (0 - 10 cm) of the soil sample may have occurred during the first 30 days after fertilization in Jau. However, the medium texture and low water retention of this layer create favorable conditions for nitrification, so the nitrate is easily transferred to the deeper soil layers. In contrast, in Piracicaba, nitrate and ammonium levels remained high, even 70 days after fertilization.
A high nitrate concentration was observed in sugarcane sap from the first sampling period in Jau (Figure 2), indicating high N availability in the soil during the first 30 days after fertilization. When there is excessive nitrate absorption, it accumulates in the plant, which is not reduced to organic forms into the plant, and then this mineral N does not associate with chlorophyll molecules [19] . Therefore, excessive absorption of nitrate does not significantly benefit crop development, despite of possible further use of previous accumulated nitrate by the plant. At 60 days after fertilization, nitrate and ammonium levels in Jau were similar, with decreasing concentrations over time, which corresponds to the low mineral N levels of the soil at the time of evaluation. In Piracicaba, ammonium concentrations were higher than nitrate concentrations at 15, 70, and 120 days after fertilization (Table 2). Results from Australian sugarcane fields have demonstrated that sugarcane prefers ammonium absorption instead of nitrate, and absorption normally occurs in soils with a good N supply during the first 3 months of crop development [20] .
Higher N absorption, regardless of the rate of N application, occurred at the beginning of the ratoon cane cycle (Table 2). In Jau, there was an increase in nitrate and ammonium levels in sap at the first sampling time,
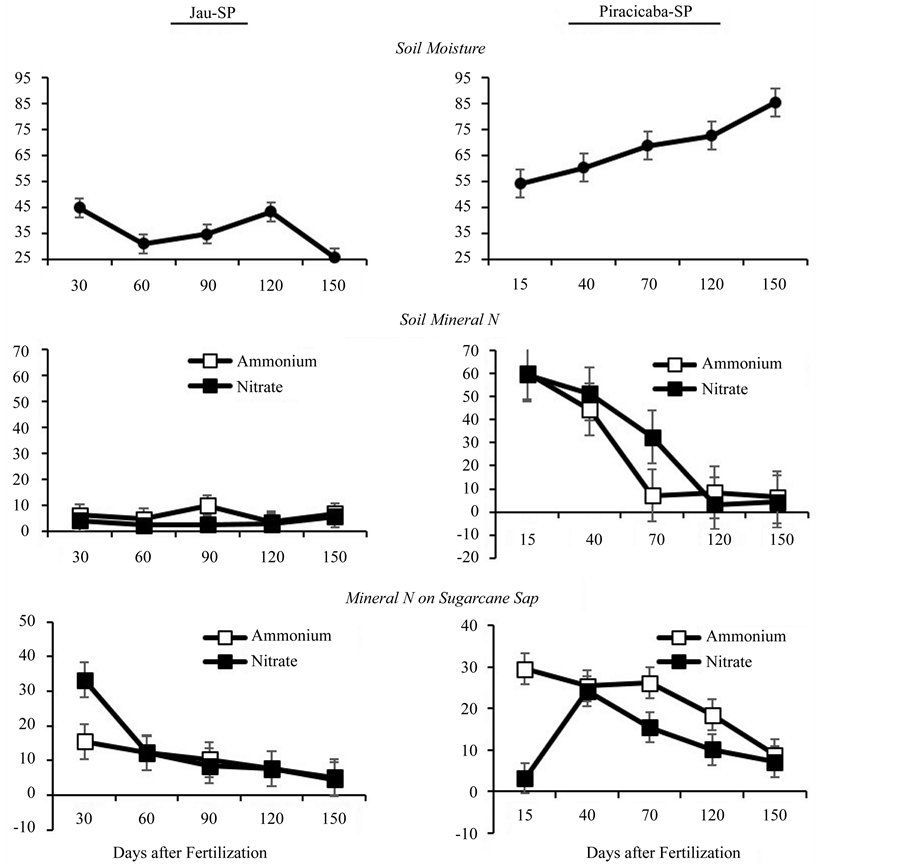
Figure 2. Average soil moisture, and mineral nitrogen in soil at 0 - 10 cm depth (average of N rates), and mineral nitrogen in sugarcane sap, as a function of days after fertilization, in two experimental sites.
and nitrate levels in particular were high (Figure 2). Despite lower concentrations than at the first sampling point, high nitrate levels were also observed in the sap at the second sampling point, 60 days after fertilization. In Piracicaba, ammonium concentrations remained high up to 120 days after fertilization, and nitrate concentrations remained high at 40, 70, and 120 days after fertilization (Table 2). Therefore, in clayey soils, the effects of N from fertilizer last longer due to the persistence of this mineral in the soil. The low nitrate concentration in sugarcane sap from Piracicaba during the first sampling period is probably a result of the short time period (15 days) since fertilization. Even with similar levels of nitrate and ammonium in the soil (Figure 2), the preference for ammonium in the initial stages of growth, mainly between 1 and 30 days after fertilization [20] , may explain the response observed in this study. However, this cannot be confirmed from our results given the higher nitrate content observed in sap from Jau 30 days after fertilization.
The total N content in sugarcane sap was much higher than the mineral N content (Table 3) in both locations, with mineral N representing 14.2% of total N, on average. Overall, high total N levels were observed even under the absence of N fertilizer application, demonstrating the predominance of organic forms of N in sugarcane sap. In contrast, in Jau, an increase in total N content due to N fertilization was observed in the sap only 30 days after fertilization, with no effects on subsequent samplings, and decreases in the mean levels as the crop developed
Table 2 . Mineral Nitrogen in sugarcane sap, as affected by N fertilization rates at different sampling times in two experimental sites.
1Youngest leaf sampling for sap analysis at 30, 60, 90, 120, and 150 days after fertilization (Jau-SP); 15, 40, 70, 120, and 150 days after fertilization (Piracicaba-SP). * and ** denote significance at P < 0.05 and < 0.01, respectively. αUppercase and lowercase letters are for comparison of ammonium ( ) and nitrate (
 ) levels, respectively; Tukey test (P < 0.05).
Table 3. Total Nitrogen in sap and leaf tissue from the same leaf sample taken from sugarcane at five different sampling points in two experimental sites.
1Youngest leaf sampling for sap analysis at 30, 60, 90, 120, and 150 days after fertilization (Jau-SP); 15, 40, 70, 120, and 150 days after fertilization (Piracicaba-SP). * and ** denote significance at P < 0.05 and <0.01, respectively. αUppercase and lowercase letters are for comparison of total N on sap and leaf tissues, respectively; Tukey test (P < 0.05).
(Table 3). In the clayey soil from Piracicaba, an increase in total N levels was observed up to 90 days after fertilization. In the last sampling, 150 days after fertilization, the total N levels in the sap were similar between locations and among N application rates.
In order to evaluate N concentration in leaf tissues, total N content was analyzed in the leaf blades of the same leaves from which sap was extracted from the midribs (Table 3). In Jau, no response to N fertilizer application was observed in leaf tissues of young leaves. Conversely, in Piracicaba, positive responses to N fertilization were observed in samples that also showed a positive response for total N in sap. There was a decrease in N content over time in both Piracicaba and Jau. The magnitude of the differences observed in N content at 15, 40 and 70 days after fertilization in leaf tissues from Piracicaba was lower than the observed differences in N in the sap. Therefore, total N content in sap is more sensitive to changes in N fertilizer rates than total N in leaf tissues of young leaves.
We have been unable to locate scientific studies in the literature that investigate the nutrient content of sugarcane sap using the techniques described in this study. Some studies have evaluated the concentration of N in the sap of sugarcane stems [21] [22] . However, in these studies, the main N forms in the sugarcane sap were observed to be amino acids and proteins [22] . The percentage of N as amino acids varied between 50% and 70% in symplast and apoplast sap, while the percentage of nitrate was around 10%, regardless of the sugarcane variety [21] . By only considering the recommended N application rate for sugarcane (100 kg∙ha−1), the amount of mineral N in our study consisted of 8% nitrate and 5% ammonium in Jau, 7% nitrate and 10% ammonium in Piracicaba.
After evaluating the TVD leaves in the final sugarcane growth stage, approximately 180 days after fertilization, increases in total N levels were observed in both locations as a result of N fertilizer application (Table 4). Only in the absence of N fertilizer application were the levels lower than the minimum recommended level of 18 g∙kg−1 [23] . The increase in N content in TVD leaves from Jau did not reflect the absence of a stalk yield response to N fertilization. Conversely, in Piracicaba, there was a linear increase in the N content of TVD leaves and in stalk yield (Table 4). Therefore, the low response of mineral N content (Table 2) and total N (Table 3) in the sap of leaves from Jau corresponded to the absence of stalk yield differences caused by N fertilization. In contrast, as could be predicted from the results of the sap analysis of leaves from Piracicaba, the observed linear increase in N content was reflected in significant increases in yield.
The use of N fertilizer is an important factor in the energetic and environmental balance of sugarcane, because nitrogen fertilization is responsible for 25% of fossil energy used in farm operations [24] . Therefore, better management of N fertilizer use is necessary, to ensure benefits in the long-term sustainability and energy balance of ethanol production. In Brazilian conditions, a response to nitrogen fertilization is more frequently observed in ratoon cane than in plant cane, increasing ratoon vigor and potential crop yield [1] [25] . However, studies performed with 15N recovery reported that fertilizer use by sugarcane is normally lower than 40% in ratoon cane [8] [26] [27] .
The immobilization of N in soil is one of the factors that help to explain the low amounts of N fertilizer used in sugarcane [4] . Organic matter is usually the main source of N for agricultural production [5] , and 90 days after nitrogen fertilizer application, it was probably the main source of N absorption by sugarcane in the current
Table 4 . Nitrogen content in the Top Visible Dewlap (TVD) leaf and stalk yield in sugarcane plants as a result of different nitrogen application rates in two experimental sites.
* and ** denote significance at P < 0.05 and P < 0.01, respectively.
study. After evaluating the efficiency of 15N use throughout the ratoon cane cycle, Franco, Otto [3] , observed that 30 - 60 days after fertilizer application to the ratoon, the sugarcane had absorbed practically all of the N fertilizer that they had accumulated throughout the growth cycle of the crop, and during the initial stages of ratoon. N from fertilizer was one of the main sources of N for the crop. Therefore, in medium-textured soils, such as in Jau, the parceling of fertilization may be necessary to ensure better use of N fertilizer by the crop, whereas by applying N once at the beginning of cycle, the risks of N loss through leaching increase.
Although specific fertilizer recommendations are not provided for a given leaf nutrient analysis, deficiencies, and imbalances indicate where additions or changes in the fertilization program are needed. For many crops, leaf analysis is an effective tool for diagnosing plant nutritional status [28] . However, leaf analysis in sugarcane typically has low response to changes in sugarcane nutrition, and differences in stalk yield are often observed without detecting differences during leaf analysis [7] [8] . This discrepancy can normally be explained by dilution effects [29] and the difficulties involved in determination of diagnostic leaf and the best time to sample the leaves. In our study, variations in the total N content of leaves were observed as a result of the treatments applied. However, it should be noted that the magnitude of the differences in total N content of the leaves was lower than that observed in the total N content of the sap (Table 3). In addition, the increase in N observed in leaves from Jau did not reflect the increase in stalk yield observed as a result of N application (Table 4).
The differences observed in the N content of sugarcane sap among the treatments have shown that sap analysis is a potentially effective tool to detect differences as a result of N fertilizer application, and also to observe the behavior of N forms in the youngest leaves of the sugarcane plants. In addition, this type of analysis allows better evaluation of dynamic N use in sugarcane fields. With the development of new techniques that enable the split application of N (e.g., fertigation), sap analysis may be a promising technique to support fertilizer recommendation throughout the crop cycle. In comparison with other techniques that evaluate leaf pigments and reflectance, sap analysis enables a quantitative examination of N content, and other nutrients can also be analyzed, such as phosphorus (P) and potassium (K) [9] [10] . The sap analysis technique is widely used in horticulture in Europe [12] and in perennial crops, such as citrus, in Brazil [9] [10] . This is the first study to analyze this technique in sugarcane. However, future studies are still necessary to evaluate the sensibility of the technique to management differences for other nutrients and systems, and for different varieties of sugarcane.
4. Conclusion
Higher N levels in the sap and leaves of ratoon cane were mainly observed in the initial stages of growth. In medium-textured soil, the N levels in the plants were lower than those in plants grown in clayey soil, under similar N application rates and quantities. Sap analysis shows high sensitivity to N fertilizer application, and thus this analysis may be used effectively in sugarcane for decision making regarding parceling of fertilization and to understand better the behavior of N in sugarcane.
Acknowledgements
The authors are grateful for the funding provided by São Paulo Research Foundation (Fapesp); project 2008/ 56147-1.
NOTES
*Corresponding author.