1. Introduction
Energy conservation (i.e. using less energy for a service) is essential for the entire chain of energy; from fuel extraction, fuel energy conversion to Electric Power (EP) including EP generation, transmission and distribution to usage in industry, transportation, buildings, and for consumers; and consumed EP and fuel. In the hot, humid, and sunny Gulf Cooperation Countries (GCC), renewable energy sources such as solar can play a key role by utilizing plentiful solar energy to generate EP and to desalt seawater. The EP is necessary to meet cooling demands and other industrial and human activities. Desalting seawater and treating waste water for reuse are processes that consume extensive amounts of energy, and needed in this water-scarceregion. While renewable energy is important for sustainable future, Fossil Fuels (FFs) are continued to be the mainly used energy source for the foreseeable future. It’s therefore important to ensure that FFs are used as efficiently as possible while applying renewable energy application should be increasing.
Qatar is a small country but is ranking worldwide among the highest per capita (/ca) in: income, production and proven reserves of oil and Natural Gas (NG), energy(fuel and electricity) and water consumptions, CO2 emission, water scarcity, and shortage in food production. In 2010, Qatar’s economy grew by 19.40%: the fastest in the world. The rapid growth is due to ongoing increases in production and exports of Liquefied Natural Gas (LNG), oil, petrochemicals and related industries.
Qatar, the largest exporter of LNG, is a major force in global energy markets. Qatar’s Electric Power (EP) has grown considerably in recent years with amazing doubled installed EP capacity in just two years, 2009-2011, and doubled EP and Desalted seawater (DW) generations in 6 years (2004-2010). These raise concerns about the unusual vulnerabilities (or insecurity) in water, food, and environment.
The economy is steadily growing: oil and gas account for roughly 85% of export earnings and 70% of government revenues; these made the highest income/ca, [1]. Qatar’s successful 2022 world cup bid accelerates largescale infrastructure projects such as Qatar’s metro system, Qatar-Bahrain causeway, and solar Air Conditioning (AC) of nine stadiums. Qatar GDP (purchasing power parity) increased to $181.7 billion (estimated in 2011), compared to $153 billion and 131.2 billion estimated in 2010 and 2009 respectively [2].
The fast-growing economy, rapid urbanization, and increase of population result in raising demands on scarce water resources and energy, especially EP. These affect, negatively, air and marine environment, and make CO2 emission/ca the highest in the world. The energy forecast is expected to increase in Qatar about 6.6 times from 2000 to 2020, compared to 2.4 in Bahrain, 2.15 in Kuwait, 3.55 in Oman, 2.98 in Saudi Arabia, 2.83 in UAE, and 3.11 for all GCC, [3].
Current FF consumption patterns are not sustainable. Managing domestic demands for FF and EP remain key challenges. An energy-wasteful culture has grown up by subsidizing fuel and electricity prices. Qatar should adopt more energy-efficient practices in building design and transport infrastructure. The need for green buildings should be recognized, and environmental issues should be addressed through architecture to reduce the dependence of heavily air-conditioned buildings absorbing vast amounts of EP.
To conserve energy, consuming sectors are to be recognized, and measures to make them more efficient should be outlined. The main consuming sectors are the Cogeneration Power Desalting Plants (CPDP) producing both EP and DW; and building AC. The CPDPs account for more than 50% the fuel energy consumptions in most Gulf Co-operation Council (GCC). The AC load account for 70% of the EP peak summer load, and about 50% of annual EP consumption. Energy conservations in these two sectors, (CPDP and building AC), are discussed in this paper. The state of these two sectors (CPDP and building AC) is outlined first, and followed by suggested measure to lower their energy consumptions.
2. Qatar Prime Energy Production and Consumption
In 2011, total oil production was 1.638 Million barrel per day (Mbbl/d); including crude oil of 1.296, and the consumption was 0.16 Mbbl/day. The oil export was 1.478 Mbbl/day, [4].Oil production increased about 2.3 folds from 2001 to 2011; see Figure 1, [5].
Latest data on Natural Gas (NG) production, consumption, and export are given in the next table in terms of Billion Cubic Meter (BCM), and Billion Cubic Feet (BCF), [5].
The NG production increased about 5.4 folds from 27 BCM/y in 2001 to 146.8 BCM/y in 2011. Exported NG was 14.04 BCM/y in 2000 and became 113.7 BMC/y in 2011, almost 8 fold increase. In 2010 and 2011, Qatar’s

Figure 1. Oil production and consumptions in Qatar from 2001-2010 in 1000 bbl/d, [5].
NG exports by pipelines was 19.2 BCM/y, but as LNG export jumped from 76.1 BCM in 2010 to 102.6 BCM in 2011, or 35% in only one year, see Figure 2. The consumed primary energy (oil and NG) in Million ton oil equivalent (Mtoe) is given in Figure 3, [5].
The NG production increases are accompanied by continuously rising consumptions of total energy, oil and NG, Figure 2, [5]. NG consumption increased from 11 BCM in 2001 to 23.8 BCM in 2011, more than 2.16 folds in 10 years, and 16.4% annual increase from 2010 to 2011. Oil consumptions increased from 73,000 bbl/d in 2001 to 238,000 in 2011, 3.26 folds in 10 years; and 8.3% annual increase from 2010 to 2011. The total primary energy consumption in Million tons of oil equivalent (Mtoe) increases from 12.3 in 2001 to 29.4 in 2011; 2.38 folds in 10 years, and 14.1% increase from 2010 to 2011, Figure 3. In 2011, the 29.4 Mtoe includes 8 Mtoe for oil and 21.4 Mtoe for NG, i.e. 72.8% for NG and 27.2% for oil.
Table 1 summarizes the last 10 years history of fuel energy production and consumption in Qatar, [5].
The NG is a valuable resource that should be used efficiently. Its prices (in $/Million Btu as given in Figure 4), is continuously increasing worldwide, except in the US from 2009 to 2011. This special case in US is due to the higher NG production rate compared to consumption rate. The production increased from 511.1 BCM in 2005 to 651.3 in 2011, 27.4% in 6 years; or annual 4.2% increase; while the consumption increases from 623.4 to 690.1 BCM in the same period, or 10.6% in 6 years, or annual 1% increase. From 2010 to 2011, the production increases 7.7%, while the consumption increases only 2.4%.
3. Cogeneration Power Desalting Plants (CPDP) in Qatar
3.1. Electric Power
EP and Desalted seawater (DW) are necessities for living in Qatar. DW represents 99% of municipal water supply. AC is expensive summer necessity to deal with the hot and humid (average high 42˚C, although 50˚C was reported), Figure 5. AC equipment consumes 50% of EP productions, and 70% of peak summer load, [6].

Figure 2. Natural gas production and consumptions in Qatar from 2001-2010 in Billion Cubic Meters (BCM), [5].
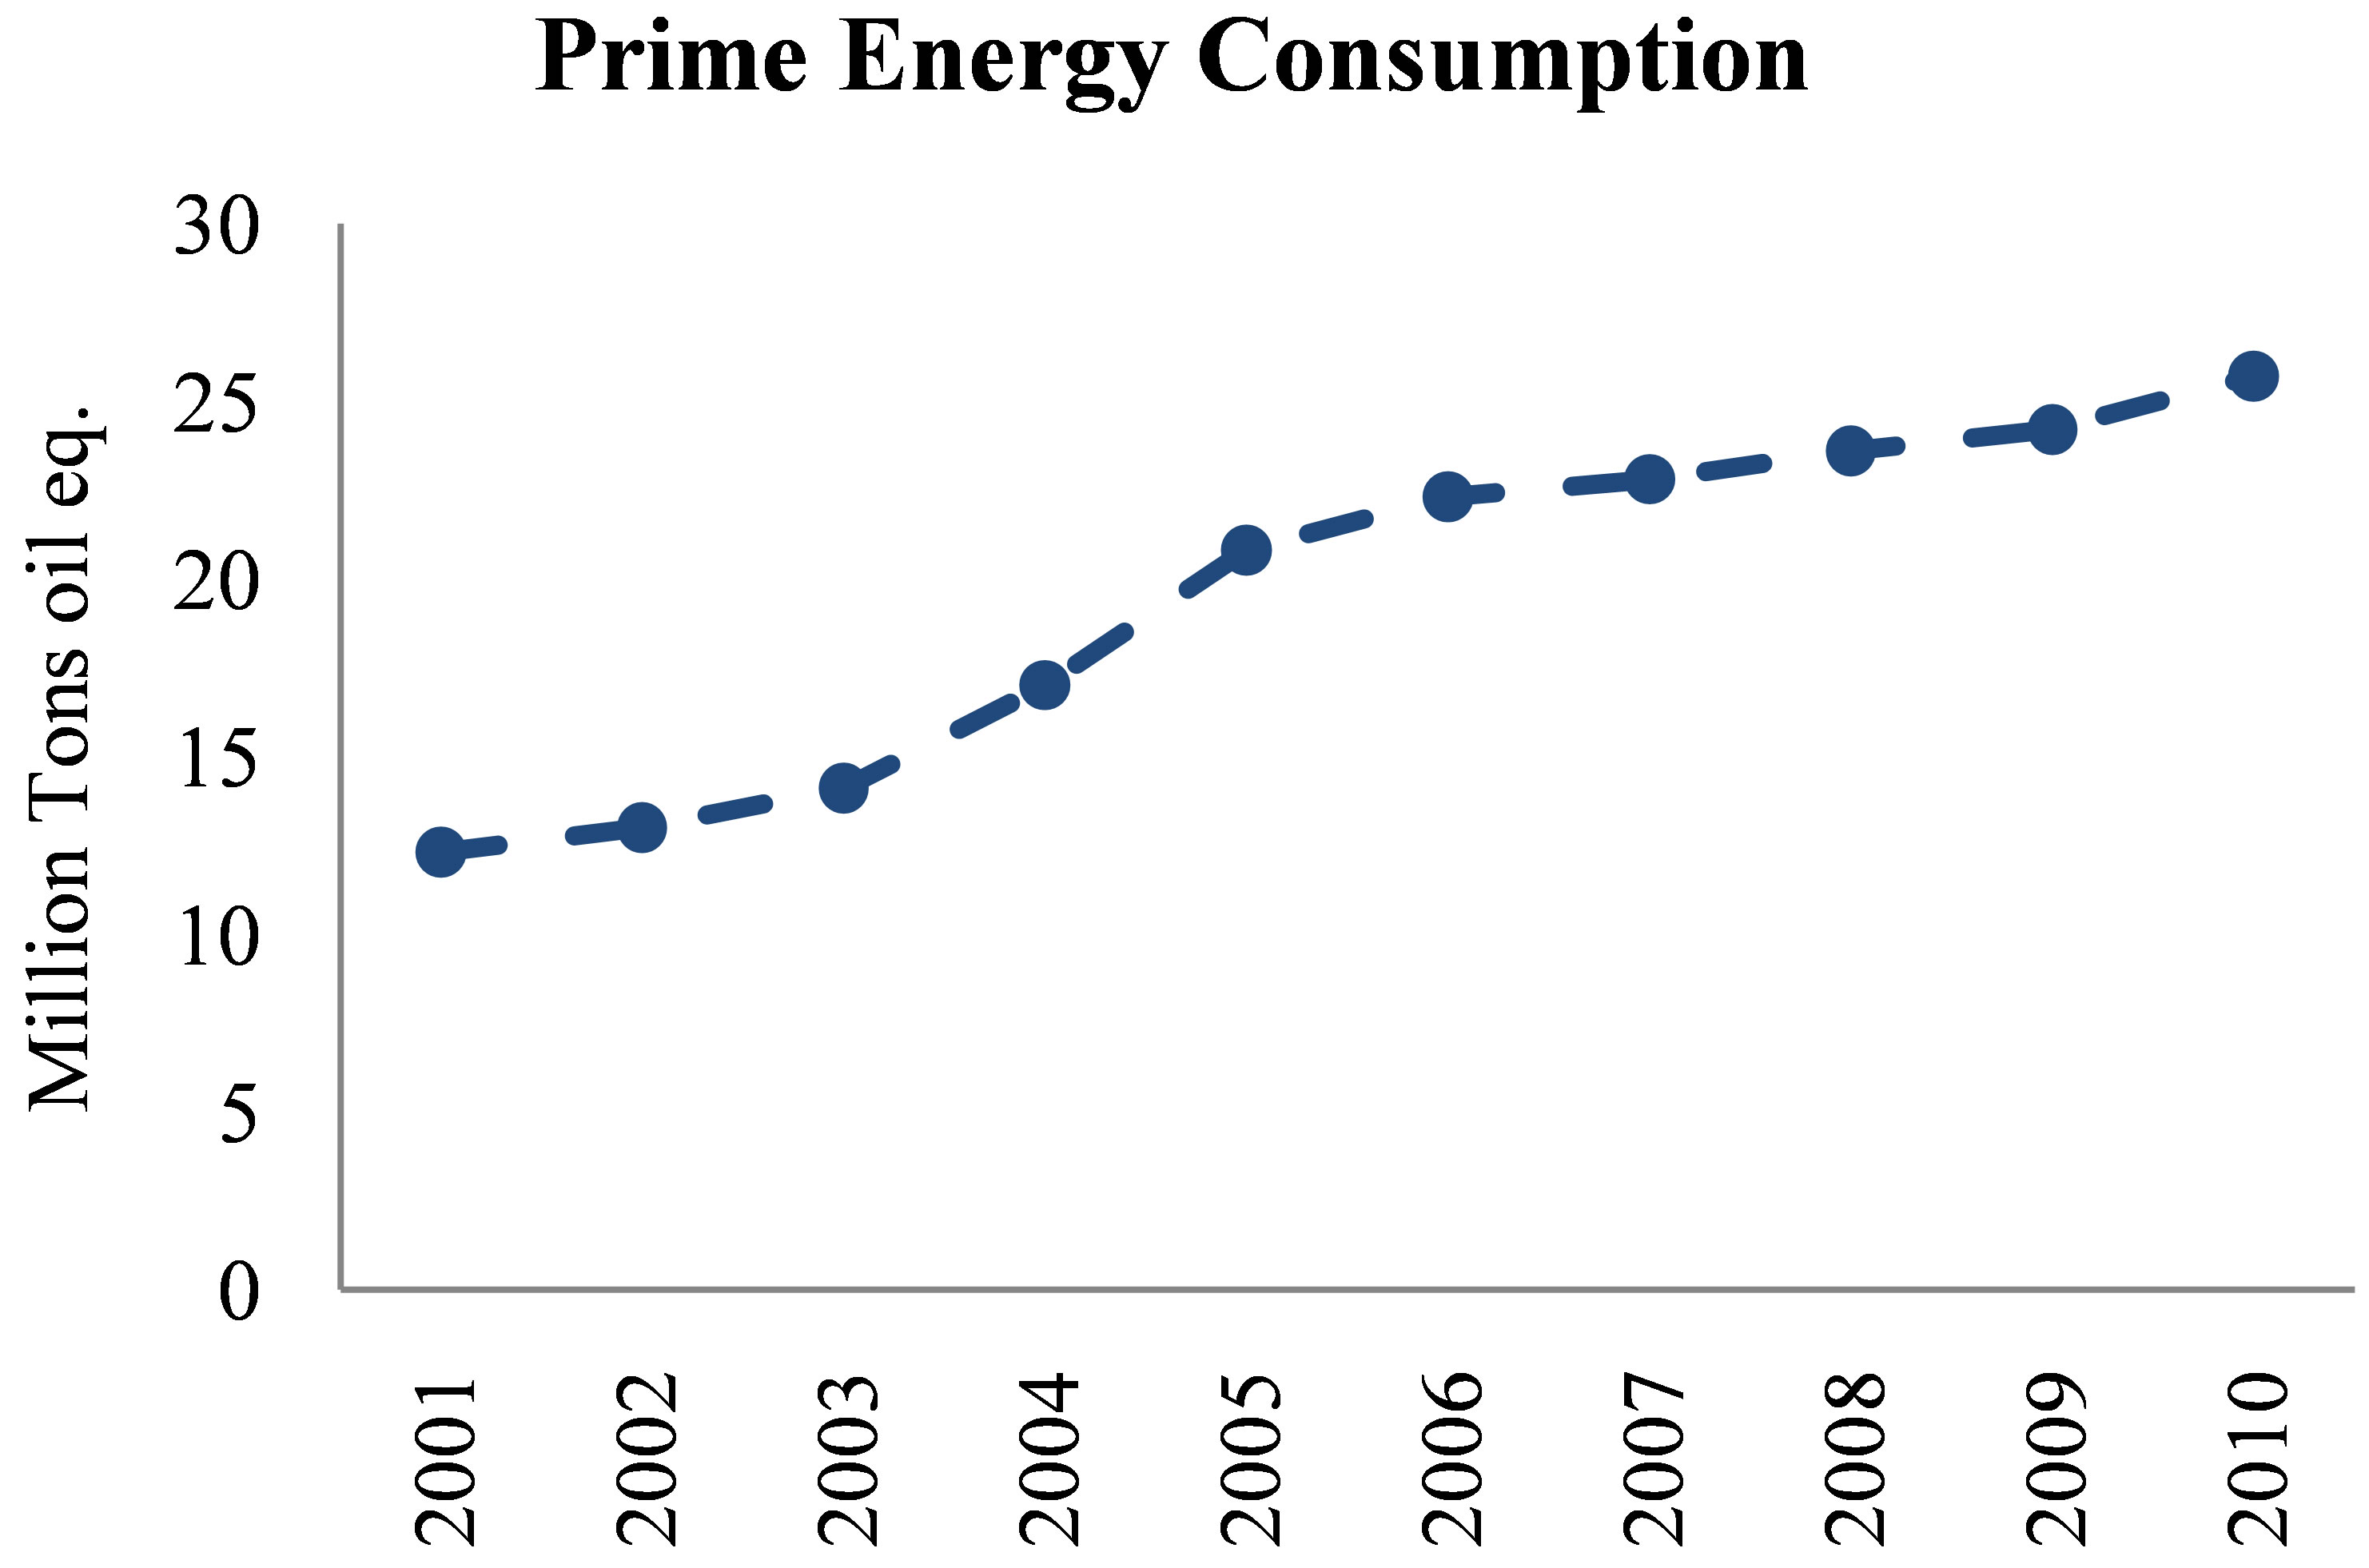
Figure 3. Primary energy consumption in Qatar from 2001- 2010 in M tons oil equivalent (Mtoe), [5].
The EP power consumption in Qatar in kWh is given in Figure 6.
The installed capacity of the EP power plants increased from 1333 MW in 1995 to almost 9000 MW in 2011, as shown in Figure 7 and next table, and as reported by KAHRAMA, [8]:
Presently the EP has excess generating capacity (since September 2009) and supplying the surplus to Bahrain and Kuwait through GCC’s Electric Grid. Qatar’s power generating capacity has reached 8800 MW, up from 5300 MW in the first half of 2009. This is going to expand to 11,500 MW in late 2012 and expected to be 13,500 MW in 2013.
The peak EP load usually occurs in summer due to AC high EP consumption, and increased as given in the next table.
The required PP capacities are determined by the expected peak load; almost doubled in 6 years.
The EP generated was more than doubled from 2004 to 2010, Figure 8, and is given in the next table:


Figure 4. World prices of natural gas in US dollars per Million British Thermal Units (MBTU), [5].

Figure 5. Average maximum and lowest temperatures in Doha, Qatar, [7].

Table 1. Fuel energy production and consumption in Qatar, [5].

Figure 6. Peak EP load increased from 1997 to 2009, and 5090 MW in 2010, [9].
Figure 9 gives the increase in the EP consumption since 1980 to 2010.
In 2009, the EP consumption was shared as: 25% billed residential buildings, 19% unbilled or non-revenue electricity (Qatari residential and unaccounted losses), 12% government and street lighting, 15% commercial

Figure 7. Qatar’s EP installed capacity in the last 10 years, [9].
sector (including light industries), 29% industrial sector (including large industries which do not generate its own EP need such as the iron industries), and 9.9% other sectors, see Figure 10, [10].
The power sector and water desalination plants depend on natural gas. Their combined gas consumption is estimated by 550 MCF/day (15.58 MCM/d). According to QP, this would reach more than 850 MCF/d (27.08 MCM/d) in 2015. Normally, electricity demand has been

Figure 8. The EP generated in the last 30 years, [data from 9].

Figure 9. The EP consumption in the last 30 years, [data from Ref. 9].


Figure 10. Electrical energy consumptions in different sectors, [10].
growing by about 7% per year , but since 2006 this has risen by 17% a year. The NG daily consumption in the power sector of 15.58 MCM/d (5.7 BCM/y) in 2010 represent 28% of the total consumed NG (20.4 BCM/y) in that year, [11].
Qatari citizens, who account for 26% of consumers and 42% of consumption, continue to receive water and power free of charge, one main reason why demand for water and power has been rising rapidly, [11].
The 4893 MW capacity in 2009 consists of 3230 MW simple Gas Turbine (GT), Figure 11, and 1650 MW GT Combined Cycle (CC) Power Plants (PP), Figure 12.
In 2010, the EP was produced in 6 main power plants (PP) of 7830 MW total capacity operated by NG. Some of these PP’s belong to:
1. The state owned utility, Qatar General Electricity and Water Corporation (KAHRAMA), including Ras Abu Fontas (RAF) A, B, B1, and, B2, Sailiya, and Doha Super South. Others belong to private companies such as.
2. Ras Laffan (RL) Power Company (RL A, B, and C),

Figure 11. Schematic diagram of simple gas turbine (GT) cycle.

Figure 12. Combined gas turbine/steam turbine combined cycle (CC), [12].
and 3. Mesaieed Power Company.
Table 2 shows the EP shares of these companies, as 2009, [8].