Investigating the minimally important difference of the Diabetes Health Profile (DHP-18) and the EQ-5D and SF-6D in a UK diabetes mellitus population ()
1. INTRODUCTION
Diabetes Mellitus is a chronic condition with an estimated worldwide prevalence of approximately 284.8 million in 2010 [1]. There are two types of diabetes. Those with Type 1 diabetes are unable to produce insulin, and those with Type 2 do not produce enough insulin, or do not use the insulin produced efficiently. Complications of diabetes may include heart disease, stroke and microvascular concerns. The many health problems related to diabetes also impact on an individual’s psychological functioning, which is associated with worry about diabetes-related health concerns [2,3], and daily and social activities [4], which are associated with the prevalence of health complications. Impacts on psychological and behavioural functioning and health related quality of life (HRQL) have been shown to increase as disease progression worsens and the level of related complications increases [4]. It is therefore essential to assess functioning and HRQL in diabetes alongside the assessment of related clinical factors.
There are now a range of diabetes specific patient reported outcome measures (PROMs) designed to assess the various constructs associated with the impact of living with diabetes and its treatment on quality of life, well-being, health status and treatment satisfaction. Many of the measures, including the Diabetes Health Profile (DHP-1; DHP-18) [5,6], Audit of Diabetes Dependent Quality of Life (ADDQoL) [7], Diabetes-39 (D-39) [8] and Diabetes Specific Quality Of Life Scale (DSQOL) [9,10], have acceptable psychometric properties and are valid for use in the intended population [11,12]. Generic PROMS such as EQ-5D [13,14] and SF-6D [15,16] can also be used to assess the HRQL of diabetes populations (and produce a utility score based on the general populations preferences that informs the economic evaluation of new and emerging interventions to be assessed across conditions. There is some evidence that these measures may be valid for assessing many of the aspects of the quality of life of people with diabetes [17-19].
In addition to being a valid and reliable measure of the health aspects of a particular condition, a PROM must also provide a score which is interpretable. This enables the important effects of treatment or interventions to be determined. However there remains a lack of understanding as to what a PROM score represents, what is a meaningful change in an individual patient’s score, and what changes in score correspond to being small, moderate and large [20].
Methods have been developed to estimate values that may be interpreted as a meaningful change in a PROM score between assessments (defined as the minimally important difference (MID)) [20-23]. To investigate the MID of a PROM, and combination of anchor and distribution based approaches is recommended [21]. Anchor based approaches involve assessing change on the PROM score in comparison to an external indicator of change in health status (which could be a global health change question, or a clinical indicator). Those reporting a change in health status on the external anchor are identified and used to predict values for change for the target PROM in comparison to those who report no change in health status on the external anchor. Anchor based methods can provide a valid representation of the MID value, but the anchors used must be correlated with the PROM for which values are being estimated [21].
Distribution based methods generate a value based on the distribution of responses within the sample, but cannot provide information on the level of change across time in comparison to an external indicator. Statistics such as the effect size, the half standard deviation and standard error of measurement (SEM) are used [24,25]. Combining values from both approaches are recommended as this allows for a more precise estimate of the range of the MID to be generated [21].
There has been limited work investigating the MID of both generic and condition specific measures in diabetes, with only one study estimating MID values for the DSQOL in a Taiwanese population [26]. In this study we aim to investigate the MID of the generic measures EQ- 5D and SF-6D, and the condition specific DHP-18 in a population of people with Type 1 and Type 2 diabetes in the United Kingdom.
2. METHODS
2.1. Measures
2.1.1. DHP-18
Developed from the 32-item DHP-1 [5] the DHP-18 [6] consists of 18 items assessing psychosocial and behavioural dysfunctioning in diabetes across three domains: Psychological Distress (PD; 6 items), Barriers to Activity (BA; 7 items) and Disinhibited Eating (DE; 5 items). The domains are based on a conceptual framework which focuses on the emotional and behavioural impact of living with diabetes. The raw scores for each domain are rescaled to a metric score between 0 and 100 which can also be converted into a norm score (with a mean of 50 and an SD of 10). This enables an assessment of a score in relation to a reference group, sample or population. Metric scores were used in this study. The DHP-18 has demonstrated high levels of reliability, validity and patient acceptability [6]. However, no previous work has investigated the MID of the instrument. The DHP-18 is the diabetes-specific outcome measure selected for the UK Department of Health Patient Reported Outcome Measures (PROMs) Pilot for Long Term Conditions in Primary Care, and has been used in multinational clinical trials, quality of life outcome research, population surveys and clinical practice. It has been adapted for use in 26 different languages and can be completed using a range of media including face to face and telephone interviews, using paper/pencil, online, and also electronic form.
2.1.2. EQ-5D
EQ-5D [13,14] is a widely used generic measure of HRQL that is used in the assessment of the cost effectiveness of new treatments and interventions. EQ-5D assesses health across five dimensions (mobility, self care, usual activities, pain/discomfort and anxiety/depression) each with three response levels (none, some, extreme/unable). A selection of the possible 243 health states produced by the EQ-5D were valued by the UK general population to produce a single figure utility score for each health state that reflects the preferences of the population [14]. The range is the utility score is −0.594 to 1, where one equals full health, zero equals dead, and negative values are perceived as states worse than dead. Although no previous work has investigated the MID of EQ-5D in diabetes, a number of studies have attempted to define the MID across a range of other conditions. Walters and Brazier [27] estimated the MID of the EQ-5D across eleven patient groups (including chronic obstructive pulmonary disease, arthritis, irritable bowel syndrome, back pain, myocardial infarction, limb reconstruction and leg ulcers) to be in the range of −0.011 to 0.140 (mean 0.074), indicating that the MID may vary across conditions and patient groups. In cancer, the MID of EQ-5D has been estimated in the range of 0.10 to 0.12 [28].
2.1.3. SF-6D
The SF-6D is a generic preference based measure of HRQL [15,16] that is also used in the assessment of cost effectiveness. The classification system assesses health status across 6 dimensions (physical functioning, role limitations, social functioning, pain, mental health and vitality) with between 3 and 5 response levels. A selection of the possible 18,000 health states have been valued by the general population to produce a single figure utility score with a range from 0.296 to 1. Walters and Brazier [27,29] have estimated the MID of the SF-6D across the eleven patient groups outlined in the previous section to be 0.011 to 0.097 (mean 0.041). This indicates that estimated MID values for the same patient groups differ between the two generic preference based measures.
2.2. Sample
A longitudinal dataset from a UK community-based postal survey carried out in one health authority area [30] was used for both the anchor and distribution based analysis. The sample used in this study included 1092 respondents with a reported diagnosis of either Type 1 (n = 93) or Type 2 (n = 999) diabetes who fully completed the EQ-5D, SF-6D and DHP-18 at both baseline and one year follow up. This equates to 27.7% of all people with diabetes in the health authority area (Table 1 displays the sample characteristics). At baseline, 38.8% of the sample report diabetes related health complications and this increased to 48.9% at follow up. A large majority also report co morbid health complications at baseline (80.0%) and follow up (93.4%), and the most common were arthritis, hypertension, high cholesterol and depression and anxiety. Data on the characteristics of people with diabetes in the health authority area who did not respond to the survey are not available.
Participants were identified from primary care diabetes patient registers, and were sent a postal questionnaire to complete with a subsequent reminder letter if the survey had not been returned. Respondents were included in the study if they were aged ≥18 and were excluded if they were pregnant.
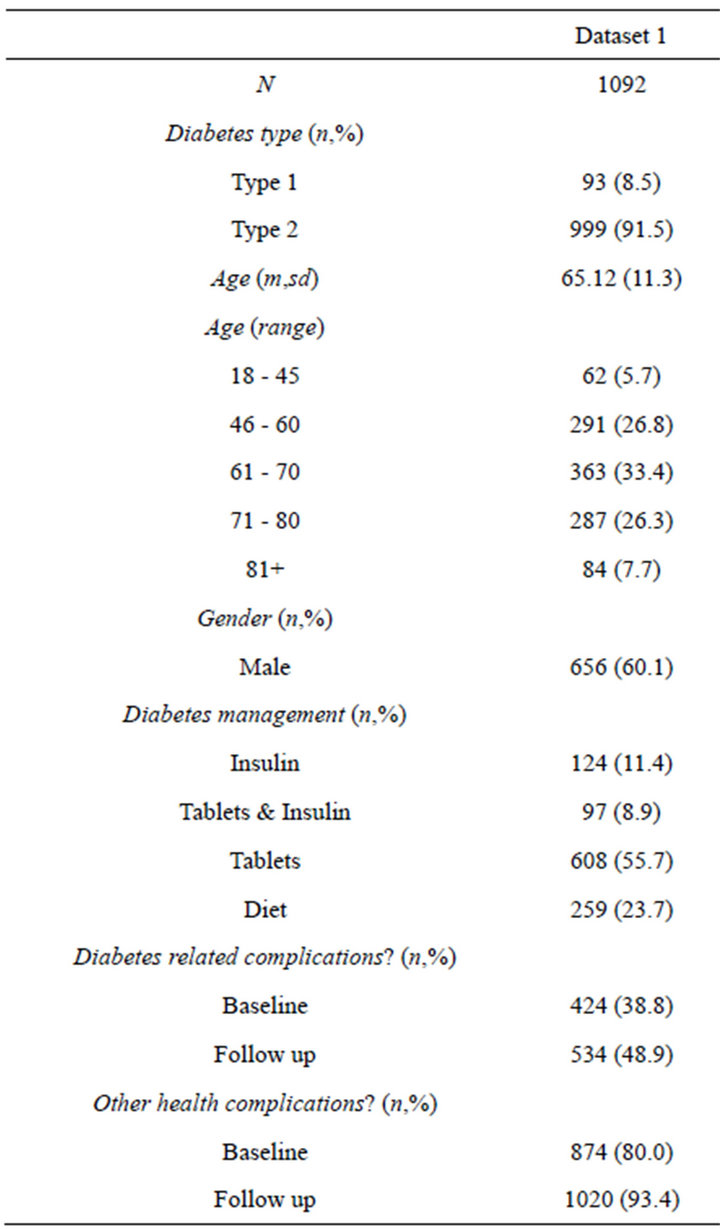
Table 1. Participant characteristics.
2.3. Investigating the MID
2.3.1. Anchor Based Approach
1) Testing Anchor Validity The external anchor used in this study was a global rating of health change (GRoC) item that can identify respondents who have experienced and self report a small but important change in health. The GRoC item assesses whether health has improved or worsened over the past 12 months on a 5 point Likert scale (much better 5), somewhat better 4), stayed the same 3), somewhat worse 2) or much worse 1)), and was administered at follow up to investigate change in health status during the study period. GRoC items previously been used as an external anchor to calculate MID estimations [27,29,31]. A small but important change on the global health item was defined by a score of 1, 2, 4 or 5 with patients scoring 3 defined as reporting no change in health status.
To provide a valid estimate of the MID, it is recommended that the GRoC anchor is correlated with the baseline and follow up PROM scores at a level of at least 0.3 [21], with the correlation at follow up being greater than that at baseline. This was tested for each of the three DHP-18 domains, and the EQ-5D and SF-6D utility scores. We also assessed the pattern of the mean level of change for each of the instruments across each category of the GRoC anchor. Both of these indicators were used to establish whether the anchor was valid for estimating the MID of the population. All analysis was carried out using SPSS v19.
2) Calculating the MID The MID was calculated by subtracting the mean change on the DHP domains for patients reporting no change on the anchors from those who report small change. This approach includes the whole sample in the calculation. In line with past work [29], the direction of the change was reversed (multiplied by minus 1) for those reporting a small negative change in HRQL (i.e. those reporting a 4 or 5 on the global health change item). Confidence intervals around the MID values were calculated using Bootstrapping techniques on 1000 subsamples were used to calculate the mean values used for the calculations, and the 95% confidence intervals for the estimated values.
2.3.2. Distribution Based Approach
Three commonly used distribution based methods were employed in this study to investigate values for the MID, and effect sizes were also calculated to explore the relative size of the differences between those reporting change in health on the anchor GrOC question and those reporting that health has stayed the same. The three methods used to investigate values for the MID were the Standard Error of Measurement (1SEM) [24,25], 0.5 [32] and 0.33 [28] Standard Deviation (0.5SD/0.33SD) estimations. For the 1SEM approach Eq.1 was used.
 (1)
(1)
The test-retest statistic (calculated as the correlation between the baseline and follow up dimension scores) was used as the reliability coefficient as this provides an indication of the relationship between the baseline and follow up scores, and has also been used in previous studies estimating MIDs using distribution based approaches [29,31]. Values produced using the 1SEM approach have been shown to be of a similar magnitude to both the 0.5SD and anchor based values across a range of studies [25,33].
The 0.5SD estimation is calculated using Eq.2, where 0.5 corresponds to a moderate effect size. This calculation has been used in a range of studies estimating the MID, including for EQ-5D and SF-6D [27,28], and is used in this study it has been shown that 0.5SD approximates the MID for a range of PROMs across a range of conditions [34].
 (2)
(2)
The 0.33SD approach (calculated using Eq.3) is included here for comparability with other studies estimating the MID of EQ-5D, but evidence to support the approach is less clear.
 (3)
(3)
Confidence intervals for the predictions were generated using bootstrapping methods across 1000 subsamples.
We also investigated the effect size of the change in DHP-18 dimension scores for those reporting a change in health status (i.e. an improvement or deterioration), and those reporting no change on the anchor. Effect size was calculated by dividing the change on each domain between baseline and follow up by the standard deviation of the mean baseline score. This was used as a further test of the validity of the MID estimations, with values of 0.2 defined as small, 0.5 defined as moderate, and 0.8 defined as large [35].
2.4. Sensitivity and Agreement
To investigate sensitivity, the MID values derived from each approach were used to classify the sample based on those who demonstrated improvement, deterioration or no change according to the derived values. Cohen’s kappa (that measures agreement taking into account the level of agreement expected by chance) and Kendall’s tau (a measure of the strength of the dependence of two ranked variables) were used to investigate agreement between the classifications of the sample using the MID estimations.
3. RESULTS
3.1. Anchor Based Approach
The correlations between the GRoC anchor and the DHP-18, EQ-5D and SF-6D are displayed in Table 2 along with the mean scores for each measure across each GRoC anchor category. The relationship between the GRoC anchor and the mean change from baseline to follow up is displayed in Figure 1. The majority of the correlations between the DHP-18 and the GRoC anchor are significant but below the minimum recommended threshold for MID calculation of 0.3. Furthermore, there is not a consistent relationship between the GRoC categories and the mean change between baseline and follow up, with scores on the Psychological distress and Barriers to activity indicating improvement in health when the GRoC anchor indicates that health has decreased over
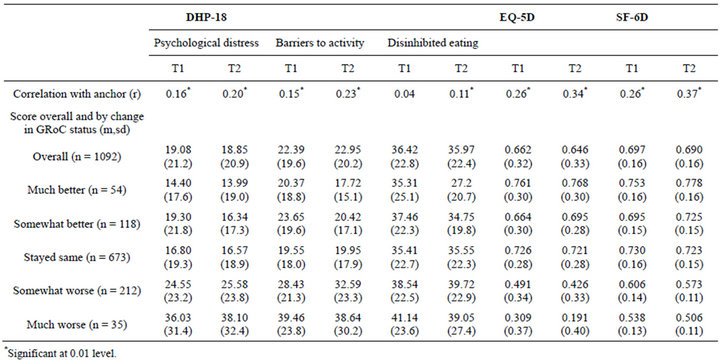
Table 2. Testing anchor validity and scores on each measure by GRoC category.
time (Figure 1). In contrast, the correlations between the GRoC and the generic measures exceeds the minimum at follow up and approaches the minimum at baseline, and Figure 1 demonstrates that as self reported global health decreases, this change is also reflected on the utility scale. Therefore, the GRoC anchor was only be used to estimate MID values for the EQ-5D and SF-6D.
The estimated anchor based and distribution based MID values are displayed in Table 3.The test-retest reliability statistics used for the 1SEM distribution method were calculated as 0.766 (PD domain), 0.746 (BA domain), 0.751 (DE domain), 0.765 (EQ-5D), and 0.761 (SF-6D).
For the DHP-18, MID estimates for the Psychological Distress domain range from 6.99 to 10.59, the Barriers to Activity domain range from 6.48 to 9.89, and the Disinhibited Eating domain range from 7.52 to 11.39. The EQ-5D estimations range from 0.058 to 0.158, and the SF-6D estimations range from 0.038 to 0.081 (the anchor based estimation is the lowest estimated value). The 0.5 SD and 1SEM estimations are of a similar magnitude across the three measures. The effect size of the change in health status over time is in the small range for all three measures.
3.2. Agreement between the Predictions
Table 4 displays the proportions of the sample who would be classified as demonstrating minimally important improvement or decrease in health using each of the MID values. Kappa and Kendall’s tau agreement statistics are calculated for the predictions in comparison to the 1SEM approach (which is used as the comparator as an estimated MID value using the method is available for all three measures, and has been shown to be equivalent to the MID for a number of PROMs in past studies [33]. There is a reasonable level of agreement across all estimations for the three DHP dimensions and EQ-5D and SF-6D, and the 0.5SD and 1SEM approach demonstrate high levels of agreement.